ABSTRACT
Background
The study explores transdermal drug delivery as a solution to traditional oral and parenteral administration challenges, highlighting improvements in efficiency and scope with micro needle technology.
Objectives
The primary objective of this study was to fabricate a natural gum-grafted matrix transdermal patch for prolonged migraine treatment, emphasizing it’s in vitro characterization.
Materials and Methods
The materials utilized included active pharmaceutical ingredients (Ibuprofen, Caffeine), polymers (HPMC, Tamarind and Moringa), solvent (distilled water), permeation enhancer (Tween-80 5%w/w) and a backing layer. For the fabrication of the patches modified solvent evaporation method was employed.
Results and Discussion
The physical characteristics, including folding endurance and drug content, are within the official limit. The thermal analysis shows its excellent thermal stability. The in vitro drug release shows the maximum 98.3% drug release up to 24 hr, while the release kinetic shows its sustained behavior upon applying different kinetic models.
Conclusion
In conclusion, this innovative and economical transdermal approach holds promise for prolonged migraine management for up to 24 hr, offering a potential alternative to address challenges associated with traditional delivery methods used.
INTRODUCTION
The skin, the body’s largest organ, acts as a drug administration route and protective barrier against external threats, comprising the epidermis, dermis and hypodermis.1 Transdermal Drug Delivery (TDD) is a painless, effective method for administering the drug through intact skin, ensuring a consistent pharmacokinetic profile, reducing peak levels and minimizing toxic side effects; especially beneficial for unconscious, vomiting or self-administering patients.2
A Transdermal Drug Delivery System (TDDS) is a medical device that administers medication directly into the bloodstream, ensuring controlled and extended-release. It minimizes gastrointestinal side effects and offers a convenient, non-invasive method. Advancements in this field reflect safe and efficient drug administration.2,3,4
Permeation enhancers are used in transdermal patch formulations to improve drug absorption by temporarily altering the skin barrier. They enhance drug solubility, pH and diffusion by increasing skin permeability, enhancing drug solubility and enhancing drug absorption.2,5,6
Understanding skin permeation kinetics is crucial for developing transdermal patches, which affect drug permeation rate; lag time and steady-state flux. Techniques like Franz diffusion cells and tape stripping can be used to study these parameters.2,5,7
A patch typically consists of a laminate structure with a backing layer, adhesive layer and drug reservoir layer, providing support and protection. Transdermal patches are a convenient and effective alternative to oral administration for certain drugs, such as insulin, methotrexate, lidocaine/prilocaine, caffeine, pilocarpine, apomorphine, paroxetine, iodine, verapamil and sumatriptan. However, they have limitations such as inadequate diffusion of large molecules, potential skin irritation, higher cost, limited permeability for hydrophilic drugs, discomfort during use, molecular weight constraints and unsuitability for all skin types. The development of transdermal patches for these drugs requires careful consideration of factors such as physicochemical properties, skin permeation characteristics and therapeutic efficacy.8,9
Migraines can be treated with various medications, including analgesics like Ibuprofen and caffeine. Ibuprofen is a selective inhibitor of COX-1 and COX-2, while caffeine enhances cognitive performance and exercise endurance. Matrix-forming polymers like HPMC, Ethylcellulose and Sodium CMC can be used. Other drugs, such as insulin, methotrexate, lidocaine/ prilocaine and caffeine, can be formulated for transdermal delivery, providing a convenient and effective alternative to other forms of administration. However, careful consideration of physicochemical properties, skin permeation characteristics and therapeutic efficacy is required.10 The aims and objectives behind our research were to fabricate a Moringa and Tamarind gum grafted modified reservoir-matrix transdermal patch for prolonged management of Migraine and it’s in vitro characterization.
MATERIALS AND METHODS
Materials
In the fabrication of transdermal patches, two natural polymers, Moringa and Tamarind gum, were employed alongside a semi-synthetic or modified polymer, Hydroxypropyl Methyl Cellulose (HPMC), Distilled water, procured from the Sigma Aldrich Germany distillation apparatus, served as the solvent. The solvent selection was a critical consideration, focusing on its ability to efficiently dissolve both the polymer and the drug, coupled with its propensity to evaporate completely without leaving any residue. Caffeine and Ibuprofen were selected as therapeutic agents for migraine management. Sodium Lauryl Sulfate (SLS), acting as a surfactant and permeation enhancer. The inclusion of Tween-80 (Polysorbate 80) was aimed to enhance permeation and functions as a non-ionic surfactant and emulsifier, particularly beneficial for improving Ibuprofen solubility. Lastly, Sodium Benzoate served as a preservative, ensuring stability throughout their shelf-life. All materials were procured from Sigma-Aldrich, meeting pharmaceutical-grade standards.11
Preformulation studies
Physicochemical characterization of drugs
These studies focus on the physicochemical studies of the drug substance that may affect drug performance and development. They also provide essential information for formulation design and molecular modification. Physicochemical drug characterization was done as the melting point was determined using MP apparatus by taking a small sample of the drug in a sealed capillary and observing it under light using a thermometer, solubility of the selected drug was determined in distilled water at room temperature, partition coefficient was determined using n-octanol as oil phase and Phosphate buffer solution (pH 7.4) as aqueous phase, calibration curves were prepared using the wavelength of 273 nm and 222 nm for Caffeine and Ibuprofen respectively, The stability studies were conducted by mixing the APIs and excipients in a beaker and observed for 3,6 and 9 weeks. The mixture was checked for any physical or chemical changes in it.12–19
Calibration curve of drugs
A calibration curve for caffeine was prepared by dissolving 100 mg of caffeine in 100 mL of distilled water. Working solutions with varying concentrations were prepared by adding 0.1 mL of hydrogen chloride to each solution. The concentrations were determined using a UV spectrophotometer at 273 nm. To prepare a calibration curve for Ibuprofen, 20 mg of Ibuprofen were dissolving in 100 mL of phosphate buffer PBS, pH 6.8, using an ultra-sonifier. The stock solution was then used to prepare four different dilutions with concentrations of 0.05 mg/mL, 0.025 mg/ mL, 0.0125 mg/mL and 0.0062 mg/mL. These dilutions were then analyzed using a UV-visible spectrophotometer at 222nm wavelength.20
Method of Transdermal Patch Fabrication
The process of fabrication of transdermal patches was carried out through the solvent evaporation method. The formulation stage involved dissolving the matrix-forming polymer in 40 mL of distilled water through careful heating and vigorous stirring (Solution 1). Subsequently, a separate solution (Solution 2) was prepared by dissolving caffeine, SLS, Sodium benzoate and Tween-80 in 20 mL of distilled water, followed by the addition of Ibuprofen. Solution 2 was gradually introduced to Solution 1 with continuous stirring, resulting in the prepared solution being poured into the cast.
HPMC was prepared using warm distilled water to prevent gelation and polymers were prepared separately in 20 mL of distilled water. The drug concentration in the formulation influenced the release rate from the transdermal patch. The solution was spread into a Petri dish and the cast material was dried for four days to form a solid matrix. The dried material was then cut into 2×1 inch rectangular patches, affixed to a backing layer and packaged for stability. Assessments were conducted to verify drug content, patch thickness and adhesive properties, ensuring the patches were protected from environmental factors like moisture, heat and light.The formulation ingredients of all the nine formulations are listed along with their concentration in the following Table 1.
| Use | Ingredients | F1 | F2 | F3 | F4 | F5 | F6 | F7 | F8 | F9 |
|---|---|---|---|---|---|---|---|---|---|---|
| Drugs | Caffeine | 130 mg | 130 mg | 130 mg | 130 mg | 130 mg | 130 mg | 130 mg | 130 mg | 130 mg |
| Ibuprofen | 300 mg | 300 mg | 300 mg | 300 mg | 300 mg | 300 mg | 300 mg | 300 mg | 300 mg | |
| Semi-Synthetic | HPMC | 3 g | – | – | – | 2 g | 2 g | 1g | 1.5g | 2 g |
| Natural Polymers | Tamarind Gum | – | 8 g | – | 4 g | – | 4 g | 3 g | 3.5 g | 4 g |
| Moringa Gum | – | – | 2 g | 2 g | 1 g | – | 1 g | 1.5 g | 2 g | |
| Solvent | Water | 60 mL | 60 mL | 60 mL | 60 mL | 60 mL | 60 mL | 60 mL | 60 mL | 60 mL |
| Preservative | Na Benzoate | 2 mg | 2 mg | 2 mg | 2 mg | 2 mg | 2 mg | 2 mg | 2mg | 2 mg |
| SAA+ Permeation Enhancer | SLS | 100 mg | 100 mg | 100 mg | 100 mg | 100 mg | 100 mg | 100 mg | 100 mg | 100 mg |
| Tween-80 | 2 mL | 2 mL | 2 mL | 2 mL | 2 mL | 2 mL | 2 mL | 2 mL | 2 mL |
Nine formulations by varying different concentrations of ingredients.
In vitro Characterization
Post-formulation studies
Transdermal patches were characterized for following parameters: physical appearance was examined visually, thickness was measured using micrometre screw gauge at three different points, weight uniformity was determined after drying at 60°C for 4 hr on a digital balance, content uniformity using spectrophotometry, flatness using by determination of % constriction, folding endurance by repeatedly folding a small strip of patch until it broke, % Moisture content using desiccator and weighing balance, surface pH was determined using pH meter, Drug content determination was done spectrophotometrically, shear adhesion test was conducted by hanging a specified weight with a steel plate to which patch was attached and peel adhesion test was done by pulling the patch at 180° after applying it to a steel plate, % elongation break test was determined by noting the length of the strip just before the breakpoint and Skin irritation was assessed using rabbit and Draiz scoring method for erythema.21–24
Drug-Polymer Interaction
Fourier Transform Infra-Red spectroscopy (FTIR)
A FTIR spectrophotometer with an attenuated total reflectance accessory was used to analyze patches incorporated with drugs, pure crystalline drugs, polymers and physical mixtures. The powder sample was dried under vacuum to remove moisture effects and numerous scans were conducted at a resolution of 4 cm-1 from 4000 cm-1 to 600 cm-1 for each spectrum.7,15
Differential Scanning Calorimetry (DSC)
The DSC is a thermal analysis method for drugs using a liquid nitrogen cooling accessory. It uses Dry Nitrogen gas purging at 50 cc/min and high-purity indium for calibration. A 2.5-5 mg sample is prepared in an Aluminium crucible cell, heated to 250°C at 10°C per min and then analyzed.15
Thermogravimetric Analysis (TGA)
Thermogravimetric Analysis (TGA) is a quantitative method that measures the mass of a sample under furnace temperatures up to 1600°C. It detects mass reduction due to decomposition, volatile compound evaporation, or decreased oxidation state. When combined with Differential Scanning Calorimetry (DSC) or Differential Thermal Analysis (DTA), TGA helps deconvolute DSC plots by distinguishing physical changes from chemical ones.26
X-ray Diffractometry studies (XRD)
XRD of medicated patches was taken. X-ray diffractometer containing 30 kV, 15 mA generator with Cu-Kα anode tube. The diffraction pattern of medicated patches was scanned over the 2 θ range of 2° and 60° at 2°/min in 0.02°2 θ step size.27
Scanning Electron Microscopy
The SEM analysis involved using a Specify Model of SEM Instrument with specific details of equipment configuration. Transdermal patches were prepared, mounted on conductive stubs and coated with gold for better conductivity. SEM imaging was performed at different magnifications to capture detailed images of surface morphology and microstructure, with multiple areas examined for comprehensive representation.14,22
Drug Release Studies
In vitro release studies
In vitro release studies can be done using a dissolution apparatus or Franz diffusion cell.
In vitro Dissolution
The dissolution study of a transdermal patch is conducted using a USP dissolution apparatus and a validated FDA Sandwich patch holder. The dissolution vessel is filled with 900 mL of distilled water, maintained at 37±0.5°C and paddle speed at 50 rpm. The patch assembly is carefully placed and samples are withdrawn at 1 hr intervals until drug release is complete. The drug content is spectrophotometrically analyzed and plotted in a standard curve, revealing in vitro dissolution profiles, cumulative drug release and dissolution rate.3,6,19
Release Kinetics
Various kinetic models can be used to determine the release kinetics, such as zero-order, first-order, Higuchi model and Korsmeyer-Peppas model. The coefficient of correlation (R2) and rate constants can be determined using the Excel Add-In Program DD Solver1 and a comparison of R2 values can be used to determine the best-fitted model.7–12
RESULTS AND DISCUSSION
Preformulation studies
Physicochemical characterization of drugs
The color of the caffeine was white; it was odorless and bitter in taste. The melting point of caffeine was 236.5°C (234-239°C). Caffeine readily dissolved in water at room temperature and its solubility was observed to be 20 g/L at room temperature. The solubility in ethanol was 15 g/L at room temperature. The water/ methylene chloride partition coefficient of caffeine was found to be 5.05. Ibuprofen was a colorless, crystalline and stable solid having a characteristic odor. The melting point was found to be 77°C. Ibuprofen exhibited insolubility in water but showed high solubility in acetone, methanol and methylene chloride. The value of the partition coefficient was found to be 3.97. Stability results showed that caffeine concentrations were within 5% of the expected concentration when stored for up to 6 months at room temperature.
Standard calibration curve of Caffeine
The standard dilutions were analysed at 273 nm through a UV Spectrophotometer. The standard calibration curve for caffeine is presented in Figure 1.
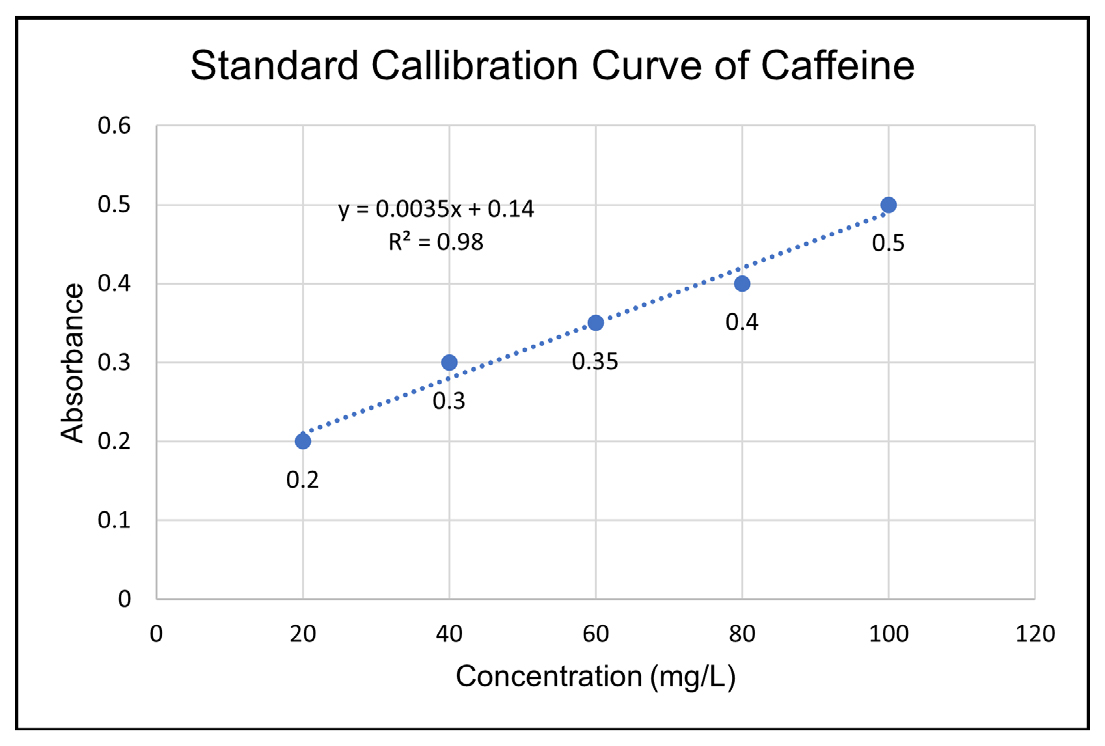
Figure 1:
Standard calibration curve of caffeine.
Standard calibration curve of Ibuprofen
The standard dilutions were analysed at 222 nm. The standard calibration curve for ibuprofen is presented in Figure 2.
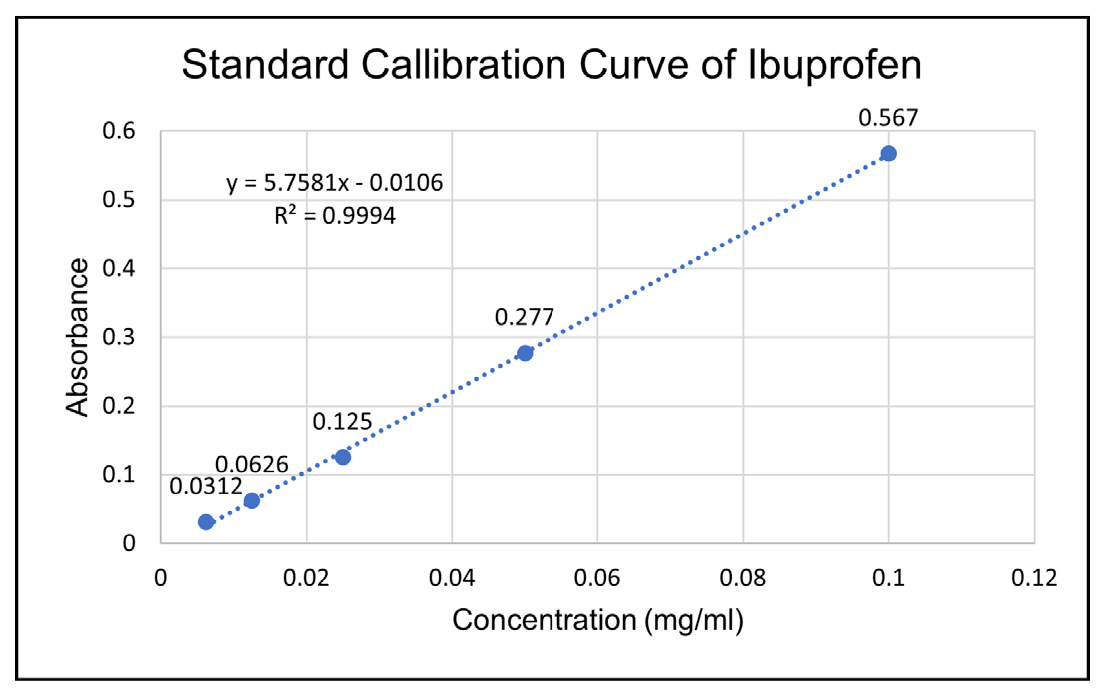
Figure 2:
Standard calibration curve of Ibuprofen.
Post formulation studies
Evaluation of patches
The physical parameters of all patches are shown in Table 2, including weight, thickness, folding endurance, diameter, area, flatness and surface pH, were assessed. The patches, sized 2×1 inches, demonstrated flexibility, uniformity, smoothness and transparency. The weight ranged from 2.049 to 2.224 g, while the thickness varied from 0.2 to 0.5 mm. Folding endurance exceeded 300, indicating strong elasticity. Flatness study confirmed 100% flatness and moisture absorption rates were minimal (0.0012 to 0.0055%), ensuring stability and microbial protection. Moisture loss ranged from 1.84 to 7.34%. The surface pH was 5.5± 0.08, aligning with skin pH to prevent irritation. Drug content uniformity ranged from 96.28 to 99.73%, indicating a consistent manufacturing process. Shear strength for patches with permeation enhancers was 20-30 min and peel strength demonstrated strong anchorage and cohesion. % Elongation ranged from 28.95±0.015% to 41.2±0.015%. Skin irritancy study on rabbits showed no erythema or oedema, confirming skin compatibility.
| Formulation code | Physical appearance | Thickness (mm) | Weight (g) | Flatness (%) | Folding endurance | % Moisture content | pH | Drug content (%) | Tensile strength (kg/cm2) | Elongation at break (%mm-2) |
|---|---|---|---|---|---|---|---|---|---|---|
| F1 | ++ | 0.204 | 2.049 | 100 | >200 | 0.0034 | 7.0 | 96.64 ±0.5 | 0.31± 0.038 | 107.34 ±19.346 |
| F2 | ++ | 0.312 | 2.145 | 100 | >200 | 0.0052 | 7.0 | 97.68± 0.2 | 1.47 ±0.051 | 18.48 ±3.490 |
| F2 | ++ | 0.224 | 2.057 | 100 | >200 | 0.0024 | 7.0 | 98.45 ± 0.2 | 0.83 ±0.047 | 31.70 ± 3.611 |
| F4 | ++ | 0.514 | 2.214 | 100 | >200 | 0.0014 | 7.0 | 97.94 ± 0.3 | 0.66 ±0.208 | 64.78 ± 11.072 |
| F5 | ++ | 0.437 | 2.050 | 100 | >200 | 0.0012 | 7.0 | 98.79 ± 0.3 | 0.56 ±0.014 | 73.34 ± 10.828 |
| F6 | ++ | 0.226 | 2.198 | 100 | >200 | 0.0046 | 7.0 | 98.45 ± 0.2 | 2.20 ±0.091 | 11.53 ± 1.876 |
| F7 | ++ | 0.585 | 2.221 | 100 | >200 | 0.0038 | 7.0 | 99.73 ± 0.4 | 2.15 ±0.077 | 12.02 ±0.862 |
| F8 | ++ | 0.234 | 2.224 | 100 | >200 | 0.0054 | 7.0 | 98.46 ± 0.3 | 1.58 ± 0.052 | 15.26 ± 1.231 |
| F9 | ++ | 0.322 | 2.071 | 100 | >200 | 0.0055 | 7.0 | 99.61 ± 0.5 | 1.31 ±0.311 | 26.75 ± 8.371 |
Physiochemical Characterization of Patches.
Drug polymer interactions
FTIR of Formulation
The FTIR results of the formulation, as shown in Figure 3, showed that it was made up of all three polymers namely Moringa, Tamarind and HPMC as at 3268.9 cm-1 due to stretching vibration of -OH group, 2924 cm-1 due to C-H stretching of arabinose and 1600.9 cm-1 due to C=O stretching which is indicative of the features of Moringa and tamarind gum. The peak at 1356.8 cm-1 is due to the bending vibration of the -OH group and 1023 cm-1 is due to C=O stretching vibration, showing the presence of HPMC in the formulation matrix. There were no characteristic peaks of drugs (Caffeine and Ibuprofen) seen in the results of the formulation which can be inferred that the drug is suitably incorporated in the matrix system of these polymers.
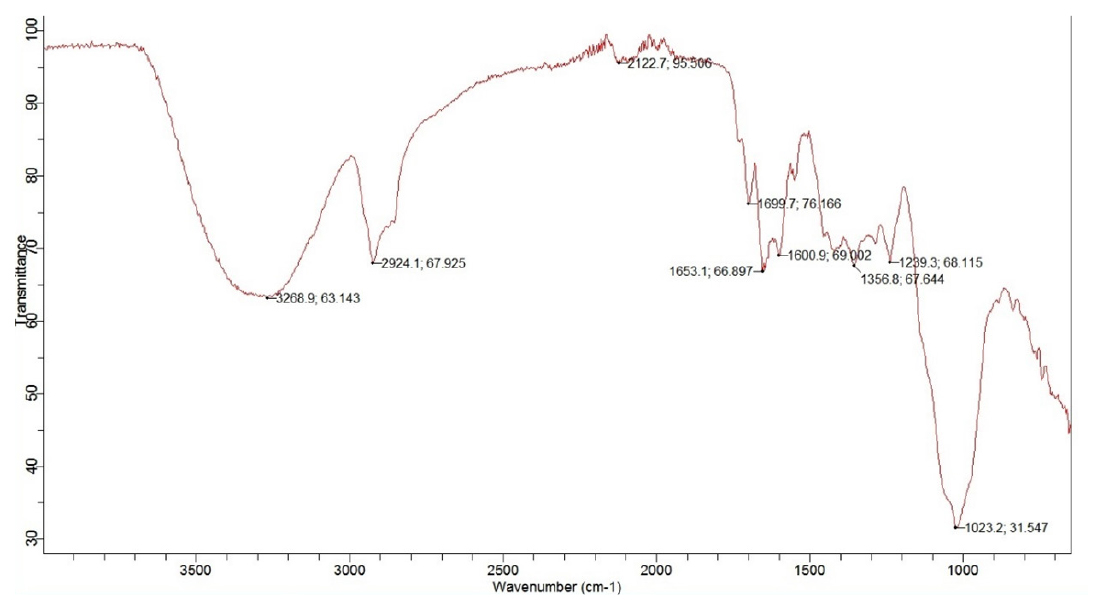
Figure 3:
FTIR results of transdermal patches.
Differential Scanning Calorimetry (DSC)
The differential scanning calorimetry thermal analysis of the patch is presented in Figure 4, which shows no change in temperature up to 100°C, but after that, it shows a downward step curve, which indicates an endothermic trough at 150°C. It shows the crystallinity and purity of ibuprofen. This observation confirms the presence of ibuprofen’s physical and chemical characteristics. After that, the upward curve at 325°C indicates exothermic change, which means heat was released caused by crystallization.
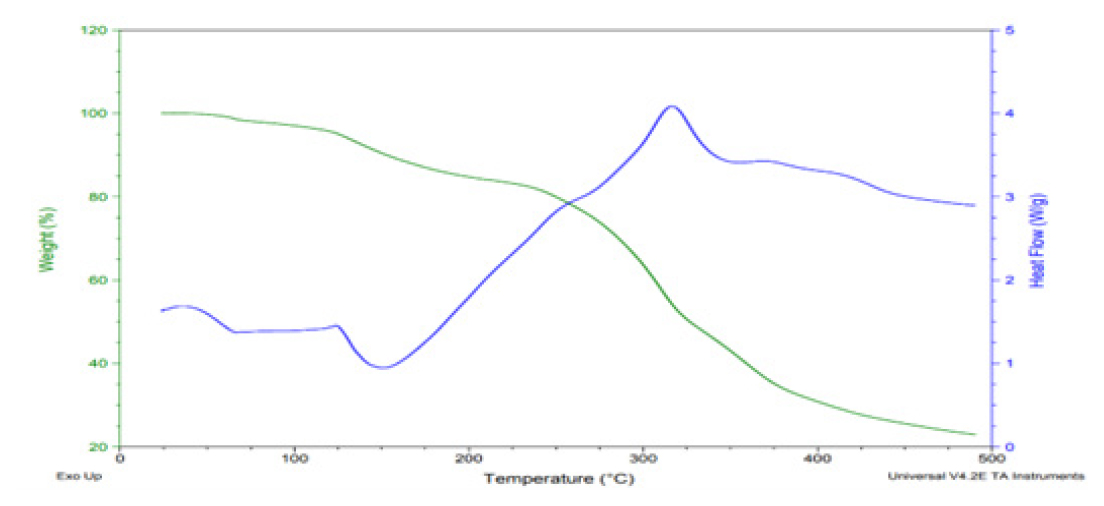
Figure 4:
DSC and TGA thermogram of transdermal patches.
Thermogravimetric Analysis (TGA)
The gravimetric analysis of the patch, presented in Figure 4, showed no change in weight loss up to 100°C, which indicated the patch’s thermal stability. After 100°C, the curve stepped down to 250°C, which showed that degradation had started. After 250°C, there was a sharp decline, showing the patch’s degradation. Complete degradation was observed at 500°C.
X-ray Diffractometry Study
Diffraction measurements were conducted using a high-resolution diffractometer; resulting diffractograms illustrated the transition from b to a-caffeine between 130 and 140°C, with characteristic peaks disappearing and emerging. In a separate study involving Ibuprofen, all crystal forms were subjected to powder X-ray diffraction pattern analysis using a Rigako model DIMAX-RC diffractometer. Alterations in peak locations, appearances and disappearances were observed, indicating changes in crystal forms, as shown in Figure 5. Distinct polymorphic forms were evidenced by variations in interplanar distance (d values) and diffraction relative Intensities (І/Іo). The preparation of a transdermal patch containing caffeine and ibuprofen involved the dissolution of both Active Pharmaceutical Ingredients (APIs) in polymers such as moringa gum, tamarind gum and HPMC. Formulated through the solvent evaporation method, XRD analysis demonstrated the complete incorporation of APIs into the polymer matrix, with no distinct sharp peaks observed, indicative of the successful integration of drugs in the matrix.
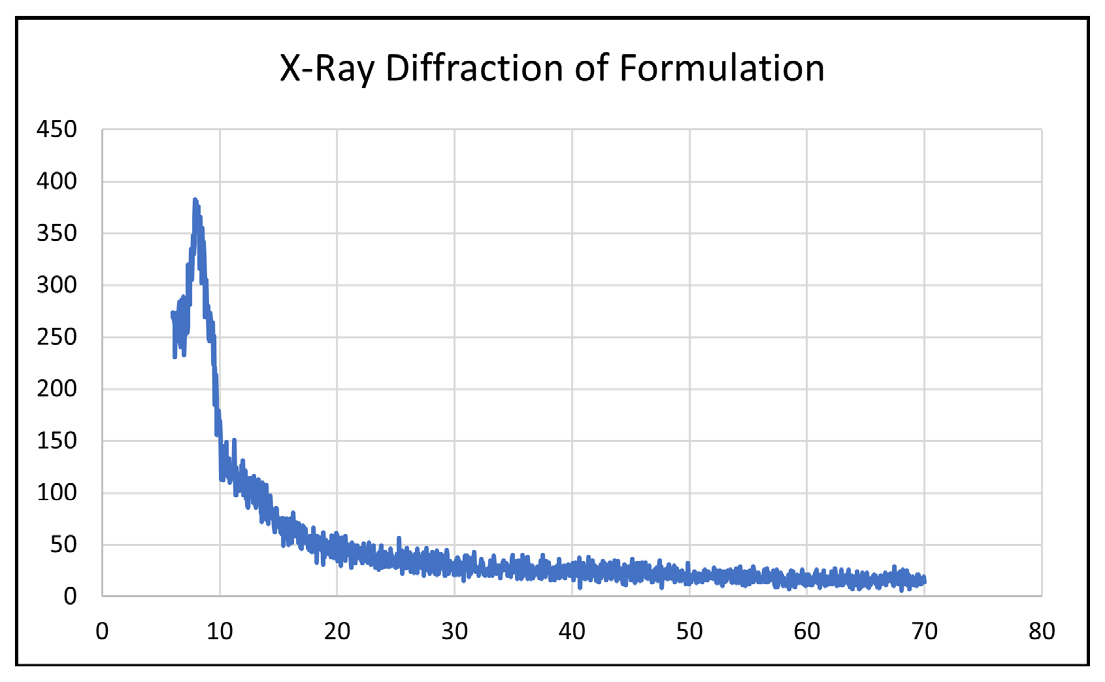
Figure 5:
XRD diffractogram of transdermal patches.
Scanning Electron Microscopy
Microscopy studies are helpful for observing the surface morphology of the matrix generated and evaluating the physical stability of the formulations. SEM studies were conducted to visualize drug distribution in the matrix patch. The SEM studies clearly showed that a reasonable matrix was formed with a uniform repeating three-dimensional mesh in which the drug is evenly distributed. The SEM results are shown in Figure 6.
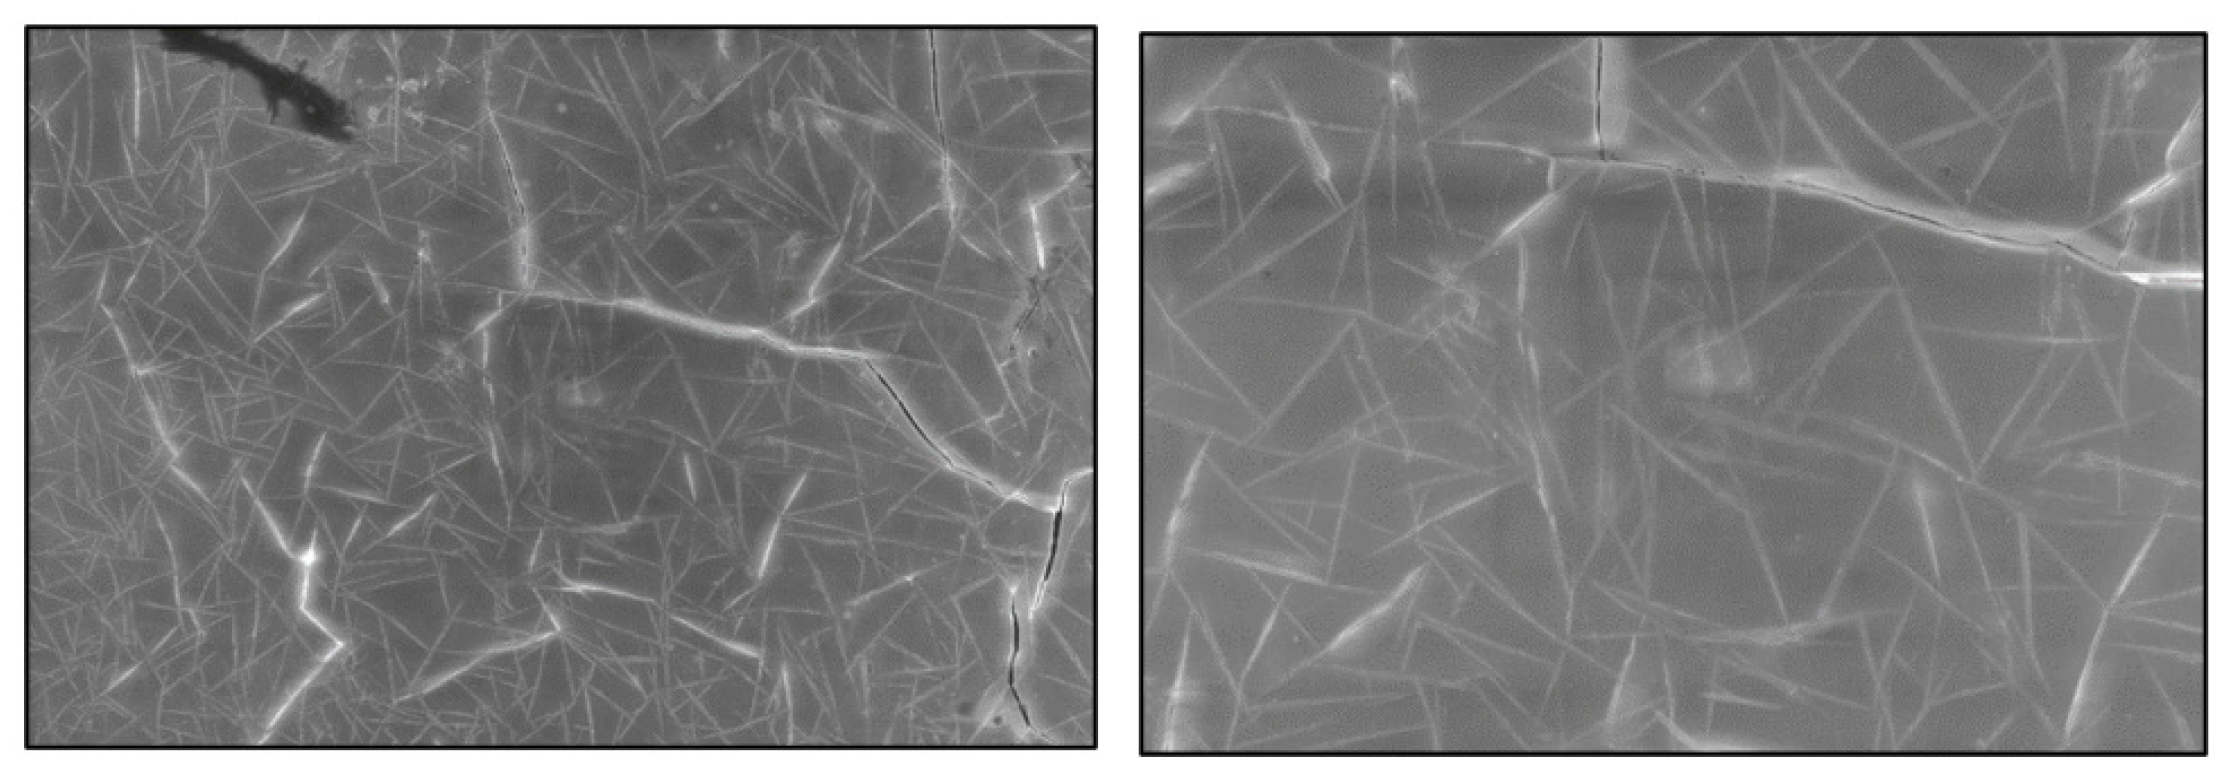
Figure 6:
SEM results at 500x and 1kx of transdermal patches matrix.
Drug release studies
In vitro Dissolution
The dissolution test was performed using the Dissolution apparatus USP under suitable conditions at 37°C for a specified time. Drug release characteristics of formulations were studied in in vitro conditions. Formulations F1, F2 and F3 have shown drug release of about 4.11%, 5.4% and 7.0% respectively in the first 30 min. The maximum drug released from formulations F1, F2 and F3 was 89.0%, 94.1% and 90.8%, respectively, with a duration of 18, 18 and 16 hr, respectively. The formulations F4, F5 and F6 showed drug release of 5.9%, 17.0% and 9.0%, respectively, in the first 30 min. The overall duration for drug release from formulations F4, F5 and F6 was found to be 20, 14 and 16 hr, respectively. The maximum drug release from formulations F4, F5, F6 is 96.9%, 97.1%, 97.1% respectively. Formulations F7, F8 and F9 showed a drug release of about 5.4%, 2.0% and 17.9% respectively. The drug release duration from formulations F7, F8 and F9 was found to be 22, 24 and 20 hr, respectively. The maximum drug release from formulations F7, F8, F9 is 97.2%, 98.3%, 93.9% respectively. The order of drug release was F8>F7>F4>F9>F2>F1> F3> F5.
The best formulation was found to be F7 and F8 having varying concentrations of Moringa gum, tamarind gum and HPMC which gave the desired drug release for 24 and 22 hr respectively because polymers were used in combination which exhibited this sustained behavior. All the formulations followed the first-order drug release. The % Drug release profile of transdermal patches is shown in Figure 7 and Table 3.
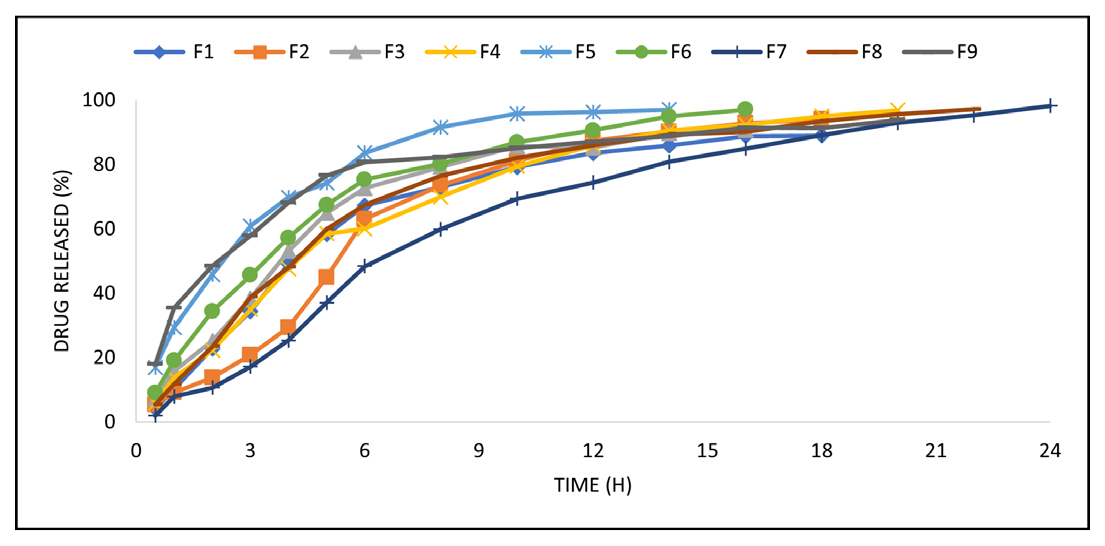
Figure 7:
% Drug release profile of transdermal patches.
| Time | % Drug Release Profile | ||||||||
|---|---|---|---|---|---|---|---|---|---|
| (Hr) | F1 | F2 | F3 | F4 | F5 | F6 | F7 | F8 | F9 |
| 0.5 | 4.11 | 5.4 | 7.0 | 5.9 | 17.0 | 9.0 | 5.4 | 2.0 | 17.9 |
| 1 | 10.3 | 9.2 | 15.9 | 13.8 | 29.4 | 19.1 | 11.8 | 7.9 | 35.4 |
| 2 | 22.8 | 13.8 | 25.2 | 22.3 | 45.8 | 34.4 | 23.4 | 10.7 | 48.5 |
| 3 | 34.4 | 20.8 | 38.4 | 35.0 | 60.9 | 45.6 | 38.9 | 17.2 | 57.9 |
| 4 | 49.1 | 29.4 | 53.1 | 47.7 | 69.8 | 57.2 | 48.1 | 25.4 | 68.1 |
| 5 | 58.3 | 45.0 | 65.0 | 58.5 | 74.3 | 67.5 | 60.0 | 37.1 | 76.6 |
| 6 | 67.3 | 63.1 | 72.7 | 60.1 | 83.7 | 75.4 | 67.5 | 48.4 | 80.8 |
| 8 | 73.0 | 73.6 | 79.3 | 70.0 | 91.6 | 80.2 | 76.5 | 59.9 | 82.3 |
| 10 | 79.2 | 81.1 | 85.8 | 79.5 | 95.8 | 86.9 | 82.1 | 69.4 | 85.2 |
| 12 | 83.6 | 87.5 | 85.3 | 86.0 | 96.3 | 90.6 | 86.0 | 74.4 | 87.1 |
| 14 | 85.9 | 90.3 | 89.8 | 90.6 | 97.1 | 95.0 | 89.4 | 80.9 | 88.9 |
| 16 | 88.9 | 92.9 | 90.8 | 92.4 | 97.1 | 90.2 | 85.0 | 91.5 | |
| 18 | 89.0 | 94.1 | 95.1 | 93.5 | 89.1 | 91.4 | |||
| 20 | 96.9 | 95.7 | 93 | 93.9 | |||||
| 22 | 97.2 | 95.3 | |||||||
| 24 | 98.3 | ||||||||
% Drug release profile of transdermal patches.
In vitro drug release kinetics
The in vitro permeation profile data of various formulations through Franz diffusion cells was subjected to analysis for different release kinetics, including zero-order, first-order, Higuchi-type and Korsmeyer-Peppas-type release kinetics. The results of all formulations are presented in Table 4. The coefficient of correlation (R2) was calculated for each release kinetics model and a comparative assessment was conducted. Notably, the first-order kinetics demonstrated higher R2 values (ranging from 0.9124 to 0.9975) compared to zero order (ranging from -0.7843 to 0.8668) and Higuchi’s square-root model (ranging from 0.6624 to 0.9674). This observation suggested a concentration-dependent drug release rate from the formulations, with formulation F6 exhibiting the highest R2 value of 0.9975, signifying its superior performance.
| Formulation | Zero Order | First Order | Higuchi | Korsmeyer | ||||
|---|---|---|---|---|---|---|---|---|
| K0 | R2 | K1 | R2 | kH | R2 | kKP | n | |
| F1 | 6.517 | 0.6375 | 0.157 | 0.9852 | 23.111 | 0.9272 | 21.699 | 0.412 |
| F2 | 6.567 | 0.6375 | 0.138 | 0.9515 | 22.703 | 0.8892 | 14.808 | 0.421 |
| F3 | 7.500 | 0.5978 | 0.185 | 0.9849 | 25.067 | 0.9246 | 24.179 | 0.321 |
| F4 | 6.217 | 0.6795 | 0.157 | 0.9954 | 23.232 | 0.9574 | 21.565 | 0.422 |
| F5 | 9.527 | 0.1626 | 0.304 | 0.9951 | 30.250 | 0.9122 | 36.437 | 0.409 |
| F6 | 7.905 | 0.5323 | 0.213 | 0.9975 | 26.533 | 0.9510 | 27.400 | 0.443 |
| F7 | 5.813 | 0.5299 | 0.168 | 0.9932 | 23.050 | 0.9296 | 24.488 | 0.419 |
| F8 | 4.985 | 0.8668 | 0.108 | 0.9755 | 20.051 | 0.9248 | 13.009 | 0.398 |
| F9 | 6.502 | -0.7843 | 0.280 | 0.9124 | 25.377 | 0.6624 | 41.235 | 0.298 |
Release Kinetics of transdermal patches.
The application of the Korsmeyer-Peppas model to the release profiles facilitated the determination of the diffusional exponent (n), indicative of the release mechanism. Notably, all formulations exhibited ‘n’ values of 0.412, 0.4210, 0.321, 0.422, 0.409, 0.443, 0.419, 0.398 and 0.298 for F1, F2, F3, F4, F5, F6, F7, F8 and F9, respectively consistent with Fickian diffusion. A ‘n’ value of 0.45 or below suggested Fickian diffusion, while values between 0.45 and 1.00 indicate non-Fickian transport and values exceeding 1.00 suggest zero order/case II transport. The obtained ‘n’ values support the conclusion that the drug releases conform to Fick’s law of diffusion across all formulations. The graphical presentation of Release kinetics of formulation is shown in Figures 8–11 below.
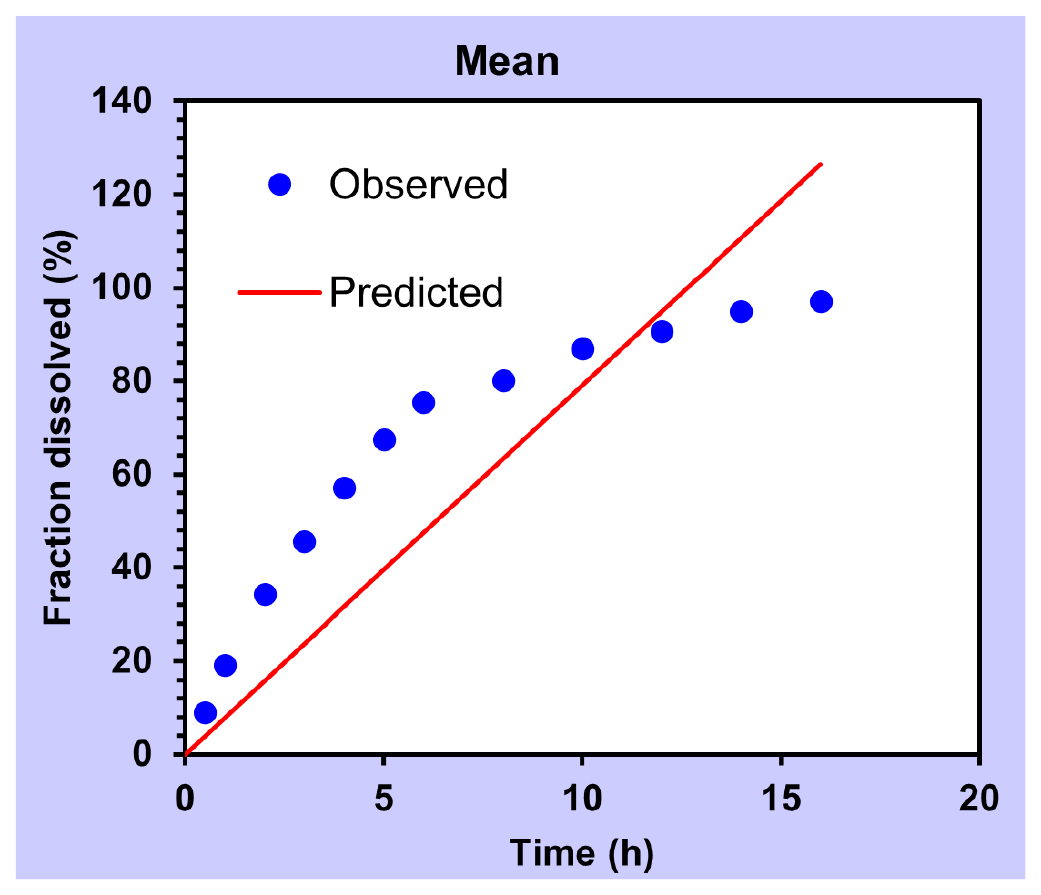
Figure 8:
Zero order.
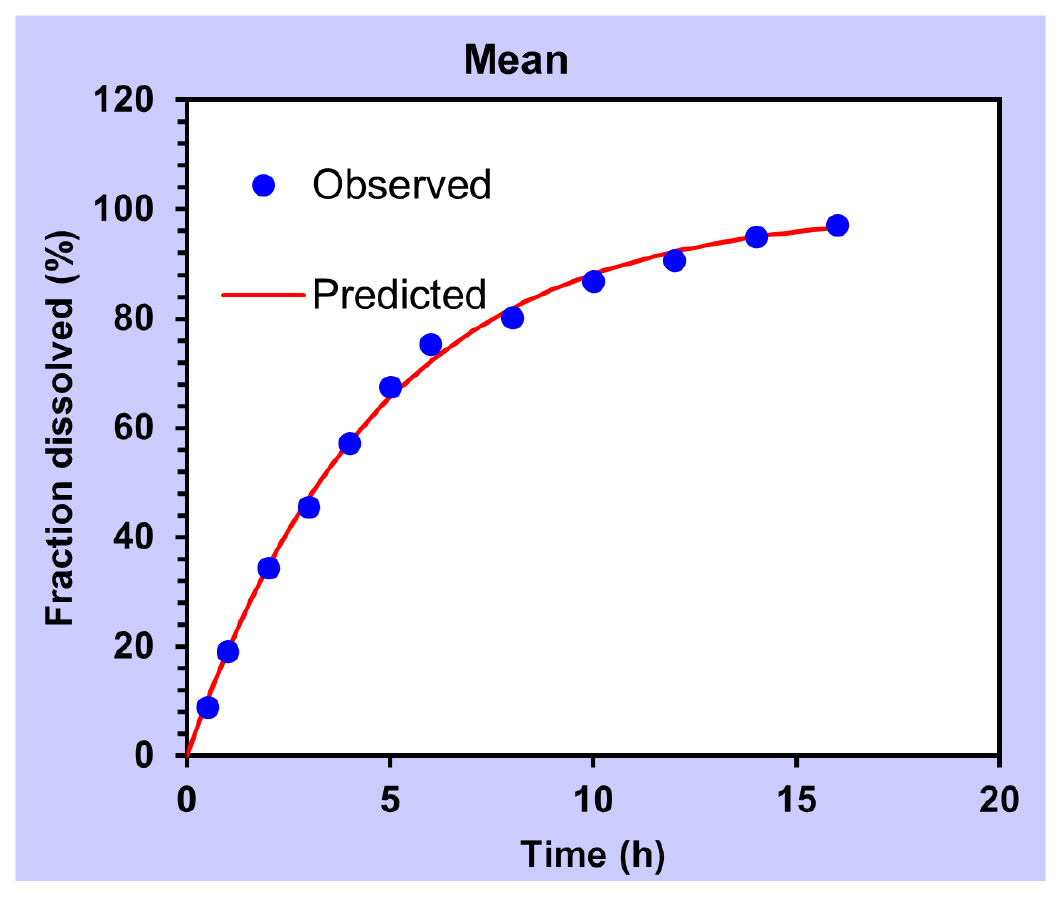
Figure 9:
First order.

Figure 10:
Higuchi.

Figure 11:
Korsmeyer-Peppas.
CONCLUSION
The transdermal patch for the prolonged management of migraine using natural polymers Moringa, Tamarind gum and a semi-synthetic polymer HPMC. Nine formulations were prepared and all of them showed satisfactory dissolution and release kinetic results and followed Fickian diffusion. A successful matrix system was fabricated and confirmed with Scanning Electron Microscope (SEM) results and the drug was incorporated in the three-dimensional mesh. It was concluded that transdermal patches showed a sustained drug release pattern over 24 hr. We can modulate the duration of the sustained drug release exceeding 24 hr by simply increasing the concentration of matrix-forming polymers, which will retard the drug release to the desired level.
Cite this article:
Mustafa MA, Farooq H, Asif E, Saleem A, Amin M, Shafiq H, et al. Design, Fabrication and Characterization of Transdermal Patches Using Different Natural Polymers Containing Caffeine and Ibuprofen for Long-Term Management of Migraine. Int. J. Pharm. Investigation. 2024;14(4):1192-200.
ACKNOWLEDGEMENT
We would like to extend our sincere gratitude to the Deanship of the Faculty of Pharmaceutical Sciences at Lahore University of Biological and Applied Sciences (UBAS) for providing the necessary resources and support that made this research possible. Their commitment to fostering academic excellence has been invaluable.
ABBREVIATIONS
| HPMC | Hydroxypropyl Methylcellulose |
|---|---|
| TDD | transdermal drug delivery |
| TDDS | transdermal drug delivery system |
| COX | Cyclooxygenase enzyme |
| CMC | Carboxy methyl cellulose |
| SLS | Sodium lauryl sulphate |
| MP | Melting point |
| PBS | Phosphate buffer solution |
| SAA | Surface active agent |
| FDA | Food and drug administration |
| SEM | Scanning electron microscope |
References
- Aboumanei Mohamed H, Mahmoud Ashgan F. Design and Development of a Proniosomal Transdermal Drug Delivery System of Caffeine for Management of Migraine: Characterization, 131I-Radiolabeling and Biodistribution Studies. Process biochem. 2020;97:201-12. [Google Scholar]

- Ramadon Delly, McCrudden Maeliosa TC, Courtenay Aaron J, Donnelly Ryan F. Enhancement Strategies for Transdermal Drug Delivery Systems: Current Trends and Applications, Drug Delivery and Translational Research. 2022;12(4):758-91. [Google Scholar]

- Janardhanan Bagyalakshmi, Vamsikrishna Ramachandra Purapu, Manavalan Rajappan, Ravi Thengungal Kochupappy, Manna Probal Kumar. Formulation Development and and Evaluation of Membrane-Moderated Transdermal Systems of Ampicillin Sodium in Ethanol: PH 4.7 Buffer Solvent System. Pharm. Sci. Tech AAPS. 2007;8(1) [Google Scholar]

- Choudhary N, Singh AP. Transdermal drug delivery system: A review. IJPP. 2021;8:5-9. [Google Scholar]

- Alkilani Ahlam Zaid, McCrudden Maelíosa TC, Donnelly Ryan F. Transdermal Drug Delivery: Innovative Pharmaceutical Developments Based on Disruption of the Barrier Properties of the Stratum Corneum. Pharmaceutics. 2015;7(4):438-70. [Google Scholar]

- Juan Escobar-Chávez José, Díaz-Torres Roberto, Cruz Isabel Marlen Rodríguez, Domínguez-Delgado Clara Luisa. Nanocarriers for Transdermal Drug Delivery.” Research and Reports in Transdermal Drug Delivery. Research and reports in transdermal drug delivery. 2012;1:3-17. [Google Scholar]

- Chandak Ashok R, Verma Priya Ranjan Prasad. Development and Evaluation of HPMC Based Matrices for Transdermal Patches of Tramadol. Clinical research and regulatory affairs. 2008;25(1):13-30. [Google Scholar]

- Chauhan Meenakshi Kanwar, Sharma Pankaj Kumar. Optimization and Characterization of Rivastigmine Nanolipid Carrier Loaded Transdermal Patches for the Treatment of Dementia. Chem. Phys. Lipids. 2019;224:104794 [Google Scholar]

- Kumar Ashok P, Rao Someshwara B, Kulkarni Suresh V. Design and Evaluation of Guar Gum Based Controlled Release Matrix Tablets of Zidovudine. JPST. 2010;2(3):156-62. [Google Scholar]

- Latif Muhammad Shahid, Azad Abul Kalam, Nawaz Asif, Rashid Sheikh Abdur, Rahman Md. Habibur, Al Omar Suliman Y, et al. Ethyl Cellulose and Hydroxypropyl Methyl Cellulose Blended Methotrexate-Loaded Transdermal Patches: and ex vivo. Polymers. 2021;13(20):3455 [Google Scholar]

- Badwaik Hemant Ramachandra, Hoque Ashique Al, Kumari Leena, Sakure Kalyani, Baghel Madhuri, Giri Tapan Kumar, et al. Array. Carbohydr. Polym. 2020;249:116893 [Google Scholar]

- Jain SK, Chourasia MK, Sabitha M, Jain R, Jain AK, Ashawat M, et al. Development and Characterization of Transdermal Drug Delivery Systems for Diltiazem Hydrochloride. Drug Deliv. 2003;10:169-77. [Google Scholar]

- Kashyap Ankita, Das Asha, Ahmed Abdul Baquee. Formulation and Evaluation of Transdermal Topical Gel of Ibuprofen. JDDT. 2020;10(2):20-5. [Google Scholar]

- Khan Dildar, Qindeel Maimoona, Ahmed Naveed, Khan Ashraf U, Khan Salman. Development of Novel PH-Sensitive Nanoparticle-Based Transdermal Patch for Management of Rheumatoid Arthritis. Nanomed. J. 2020;15(3):603-24. [Google Scholar]

- Singh A, Bali A. Formulation and Characterization of Transdermal Patches for Controlled Delivery of Duloxetine Hydrochloride. JAST. 2016;7(1):1-13. [Google Scholar]

- Saxena M. Formulation and evaluation of transdermal patches of metoclopramide hydrochloride. Indian drugs. 2006;43(9):740-5. [Google Scholar]

- Prabhu P. Formulation development and investigation of domperidone transdermal patches. Int. J. Pharm. Investig. 2011;1(4):240 [Google Scholar]

- Muñoz M. Design, development and characterization of transdermal patch of methadone. J. DRUG DELIV. SCI. TEC. 2017;42:255-60. [Google Scholar]

- Allena RT. Preparation and evaluation of transdermal patches of metformin hydrochloride using natural polymer for sustained release. Int. J. Pharm. Pharm. Sci. 2012;4(3):297-305. [Google Scholar]

- Mishra SK. Preparation and Characterization of Transdermal Therapeutic System Containing Simvastatin: A Statistical Study. IJPER. 2022;56(1):112-20. [Google Scholar]

- Zhang Yuxiu, Cun Dongmei, Kong Xin, Fang Liang. Design and Evaluation of a Novel Transdermal Patch Containing Diclofenac and Teriflunomide for Rheumatoid Arthritis Therapy. Asian J. Pharm. Sci. 2014;9(5):251-259. [Google Scholar]

- Yadav Priyanka, Dubey Anubhav. Formulation and characterization of anti-epileptic drug transdermal patch for enhance skin permeation. EJBPS. 2021;8(9):784-90. [Google Scholar]

- Shah Samip, Prabhu Prabhakar, Gundad Shankar. Formulation Development and Investigation of Domperidone Transdermal Patches. Int. J. Pharm. Investig. 2011;1(4):240-6. [Google Scholar]

- Prausnitz MR, Langer R. Transdermal drug delivery. Nature biotechnology. 2008;6(11):1261-8. [Google Scholar]

- Jalwal P, Saini J. Formulation and evaluation of transdermal drug delivery system for ibuprofen. IJPPR. 2013;4(2):794-808. [Google Scholar]

- Garala Kevin C, Shinde Anil J, Shah Pratik H. Formulation and characterization of monolithic matrix transdermal systems using HPMC/Eudragit S 100 polymer blends. Int. J. Pharm. Pharm. Sci. 2009;1(1):108-20. [Google Scholar]

- Brown Marc B, Martin Gary P, Jones Stuart A, Akomeah Franklin K. Dermal and Transdermal Drug Delivery Systems: Current and Future Prospects. Drug Deliv. 2006;13(3):175-87. [Google Scholar]

- Malviya R. Formulation, evaluation and comparison of sustained release matrix tablets of diclofenac sodium using tamarind gum as release modifier. Asian J. Pharm. Clin. Res. 2010;1(2):1-8. [Google Scholar]

- Heard CM. Array. Int. J. Pharm. 2006;317(1):26-31. [Google Scholar]


