ABSTRACT
Objectives
Fluconazole (FCZ) and Quercetin (QCT) in pharmaceutical dosage form were simultaneously quantified using a sensitive, accurate, robust, and précised Reverse Phase-HPLC Method.
Materials and Methods
RP-HPLC method was used to get the separation of FCZ and QCT using Imtakt® Unison-US-C18 column having a size of the particle, 5 μm (150 mm x 4.6 mm) operating at a 1.3 mL/min flow rate with an optimized mobile phase having Methanol-Water- Trifluoroacetic acid (TFA) in the proportion of 50:50:1%, v/v/v, respectively. The quantification of FCZ and QCT was done at 258 nm wavelength.
Results and Discussions
In the developed method FCZ was retained at a retention time of 1.896 min, while QCT was retained at a retention time of 5.637 min. The proposed method separates FCZ and QCT with a resolution of 13.261. The validation of the method was done with reference to the guideline of ICH Q2(R1). FCZ and QCT showed linearity at 4-20 μg/mL, and 1-5 μg/mL, respectively. The % RSD for the precision study was less than 2 and recovery was in the range of 98.69% to 102.14% for both drugs. In the robustness study, the proposed method has less than 2 % RSD.
Conclusion
The Method can be used to quantify Fluconazole and Quercetin simultaneously in a newly developed thermosensitive in-situ mucoadhesive vaginal gel formulation.
INTRODUCTION
Vulvovaginal Candidiasis (VVC), often called vaginal thrush, is a gynaecological disorder caused by Candida albicans overgrowth in the vagina.1,2 Candida albicans, is a pathogenic fungus that caused VVC in over 85% of cases.3
Fluconazole (FCZ) (Figure 1) is a widely prescribed first-line medicine that belongs to the azole chemical class. It is widely prescribed in the treatment of VVC and other mucosal Candida infections due to its excellent absorption with few side effects.4–7 FCZ was successful in treating VVC in 71% of patients. In isolates of Candida albicans that are FCZ sensitive, the cure success rate might be as high as 90.6%. On the other hand, it was observed that the failure rate might be as high as 100% in Candida albicans isolates that were resistant to FCZ. It was also found that FCZ resistance to Candida albicans was 10-20% in VVC patients.8,9 The MDR (Multiple drug-resistant) species of Candida albicans have emerged as a result of excessive FCZ clinical usage.10–12 Importantly, these multiple-drug-resistant strains are genetically similar to drug-sensitive bacteria and exist at higher frequencies. Thus, FCZ-resistant Candida albicans isolated in VVC treatment require innovative drugs alone or in combination with FCZ.
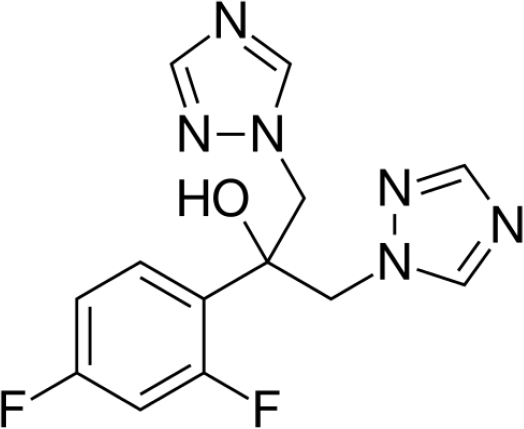
Figure 1:
Molecular Structure of Fluconazole (FCZ).
Quercetin (QCT) (Figure 2), a flavonoid, exhibits weak antifungal action and is responsible for preventing clinical Candida albicans biofilms and FCZ-resistant isolates sensitization.13,14
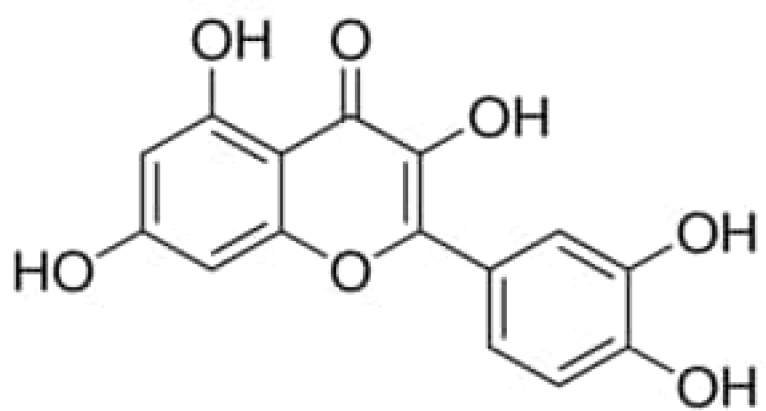
Figure 2:
Molecular Structure of Quercetin (QCT).
After QCT and FCZ treatments, the fungal loading decreased, and mucosal epithelial cell inflammation was considerably reduced, suggesting that FCZ and QCT may be a synergistic combination for treating resistant Candida albicans infections.15
The literature review reveals that there is no published data related to formulation and analytical methods for FCZ and QCT in their combined dosage form. Previously, an attempt was made in the laboratory for the formulation of thermosensitive in situ vaginal gel formulation that comprised FCZ and QCT as synergistic combinations for the treatment of Vulvovaginal Candidiasis.
This research was conducted with the intention of developing, a sensitive, precise, robust, and accurate RP-HPLC Method for the quantification of FCZ and QCT in a newly in-situ vaginal gel formulation. The proposed method was also validated with reference to ICHQ2(R1) requirements.
MATERIALS AND METHODS
Materials and Reagents
Rutu Chemicals, Panoli, Gujarat supplied the reference standard Fluconazole. Sigma Aldrich, St. Louis, MO, USA, supplied Quercetin (CAS No. 6151-25-3, MW-338.27, purity-98.0% HPLC-grade). Merck, Mumbai, India supplied HPLC-grade methanol and trifluoroacetic acid. Milli-Q (Millipore, USA) filtered triple distilled water.
Instrumentation
The analysis was performed using HPLC system equipped with a data handling system, LC solutions (Shimadzu-LC2010-CHT; Japan); SPD-M20A; Photodiode array (PDA) detector; Shimadzu and an autosampler. LC 2010 solutions (Version 1.25) software was used to record the data. During the study, an analytical balance (Shimadzu AUW220 balance, Japan), and an ultrasonic sonicator bath were all used.
Chromatographic Conditions
The separation of the drug was done using Imtakt® Unison-US-C18 Reverse-Phase HPLC column having a size of particle, 5 µm (150 mm x 4.6 mm) operating at 1.3 mL/min flow rate and 138-140 kgf/cm pressure with the optimized mobile phase contained Methanol-Water-Trifluoroacetic acid (TFA) in the proportion of 50:50:1%, v/v/v, respectively. The 20 µL was the injection volume and 29.6+2°C was the column temperature. The detection of FCZ and QCT was done at 258 nm wavelength using a Shimadzu SPD-M20A Photodiode Array (PDA) detector. The freshly prepared mobile phase was filtered using a 0.45 μm nylon membrane filter followed by sonicating for 15 min. Methanol was used to prepare standard and sample solutions.
Preparation of Standard Stock Solutions
FCZ and QCT, each 10 mg were weighed and separately transferred in clean, dry 10 mL volumetric flasks. 7 mL methanol was added to each flask as a solvent for both drugs, and each solution was sonicated for 10 min followed by diluted with methanol up to the mark. The resulting solutions have FCZ and QCT, each 1000 μg/mL.
Preparation of Working Standard Solutions
1 mL of FCZ and QCT standard stock solutions were transferred into a 10 mL volumetric flask, followed by the addition of a necessary amount of methanol up to the mark. The resulting working standard solutions have FCZ and QCT, each 100 μg/mL. For the calibration curve, linearity concentration solutions were prepared for FCZ (4-20 μg/mL) and QCT (1-5 μg/mL) in the mobile phase from various aliquots of the working standard solutions of each analyte.
Mobile Phase Preparation
It was prepared by combining Milli-Q water, methanol, and trifluoroacetic acid in the proportion of 50:50:1, v/v/v, respectively followed by sonicating for 15 min for degassing.
Preparation of Sample Solution
The suggested RP-HPLC method can be used for the quantification of FCZ, and QCT in the prepared mucoadhesive In-situ gel formulation (label claim FCZ 0.5%w/w and QCT 0.125%w/w). The assay of FCZ and QCT from the developed in-situ gel was done by following the procedure, a 2 g of newly developed mucoadhesive vaginal gel formulation (FCZ-10 mg, and QCT-2.5 mg) was added in a 10 mL volumetric flask followed by the addition of methanol up to the mark. The resultant solution was shaken well, sonicated for 10 min, and filtered using 0.45 µm nylon membrane filter which contained FCZ, 1000 µg/mL, and QCT, 250 µg/mL. 1 mL of a resulting FCZ and QCT solution was put into a 10 mL volumetric flask and methanol was added up to the mark, which contained FCZ, 100 μg/mL, and QCT, 25 μg/mL. From this solution, 0.8 mL, 1.2 mL, and 1.6 mL solutions were added into a 10 mL volumetric flask followed by the addition of mobile phase up to the mark. The resultant solution contained FCZ, 8 µg/mL, 12 µg/mL, 16 µg/mL, and QCT 2 µg/mL, 3 µg/mL, and 4 µg/mL, and all the solutions have come under the linearity range. Using the developed and validated HPLC method, the prepared sample solution of FCZ and QCT was analyzed. Analysis of the sample was carried out in triplicate.
Validation of method
System Suitability Test
Six times, the standard solution of FCZ (12 µg/mL), and QCT (3 µg/mL) were injected into the HPLC column to determine the system suitability of the method. In terms of %RSD, the results of system suitability parameters such as retention time, resolution, peak area, theoretical plate (N), and tailing factor (T) were analyzed.
Linearity and Range
Five times measurements were done to establish that the peak area and concentration have a linear relationship for both drugs across concentration ranges of 4-20 μg/mL for FCZ and 1-5 μg/mL for QCT. The analytical range was chosen based on the highest and lowest analyte concentrations at which acceptable linearity, precision, and accuracy were obtained. Furthermore, Bartlett’s test confirmed the regression lines for each drug exhibit homoscedastic variances.19
Sensitivity
The method sensitivity was assessed using the formula, LOD = 3.3 x σ/S, and LOQ = 10 x σ/S, where σ is the standard deviation of response, and S is the slope of the calibration curve.
Precision
The precision of the proposed RP-HPLC method was verified using intraday, interday, and repeatability studies. To find out method precision, three concentrations, three times, within the linearity range (8, 12, and 16 µg/mL for FCZ and 2, 3, and 4 µg/mL for QCT) were analyzed within a day (intraday precision) and on three different days (interday precision). The method repeatability was confirmed by injecting 20 µL of FCZ (12 µg/mL) and QCT (3 µg/mL) in seven times. For each precision study, the % RSD was calculated.
Accuracy
Using an optimized method, accuracy studies were done by spiking known amounts of each standard analyte at 50%, 100%, and 150% levels to the developed formulation and analyzing it in triplicate using the developed method. Accuracy studies of FCZ were performed by spiking various concentrations of FCZ standard (4, 8, and 12 µg/mL) to the target concentration of FCZ (8 µg/mL) in a developed vaginal gel formulation. Accuracy studies for QCT were similarly performed by spiking various concentrations of QCT standard (1, 2, and 3 µg/mL) to the target concentration of QCT (2 µg/mL) in the developed vaginal gel formulation. Each drug’s recovery % was then determined.
Specificity
The specificity was established by comparing the chromatograms of the blank, sample, and standard solution of each analyte to check for any interference of excipients. The excipient chromatogram must not interfere at FCZ and QCT retention time.
Robustness
The ability of an analytical method unchanged by minute and deliberate variations in the method, according to ICH guidelines, is referred to as robustness.20 The chromatographic system was deliberately altered, with changes to the mobile phase composition (methanol content – 49 mL, and 51 mL), trifluoroacetic acid content (0.9 mL and 1.1 mL), flow rate of mobile phase (1.2 mL/min, and 1.4 mL/min), and detection wavelength (256 nm, and 260 nm). The method robustness was investigated by injecting 20 µl of FCZ (12 µg/mL) and QCT (3 µg/mL) into an HPLC column. In each variation, three replicates of each drug were injected, and %RSD was calculated with reference to system suitability parameters for each drug.
RESULTS AND DISCUSSION
RP-HPLC method development
Selection of detection wavelength
It was determined by scanning a standard solution of FCZ (10µg/mL) and QCT (10µg/mL) between 200 and 400 nm with an ultraviolet spectrophotometer. The overlapping spectra of the two analytes showed that both FCZ and QCT absorbed appreciably at 258 nm (Figure 3), hence this is the wavelength that should be considered as the common detection wavelength for quantifying both analytes.
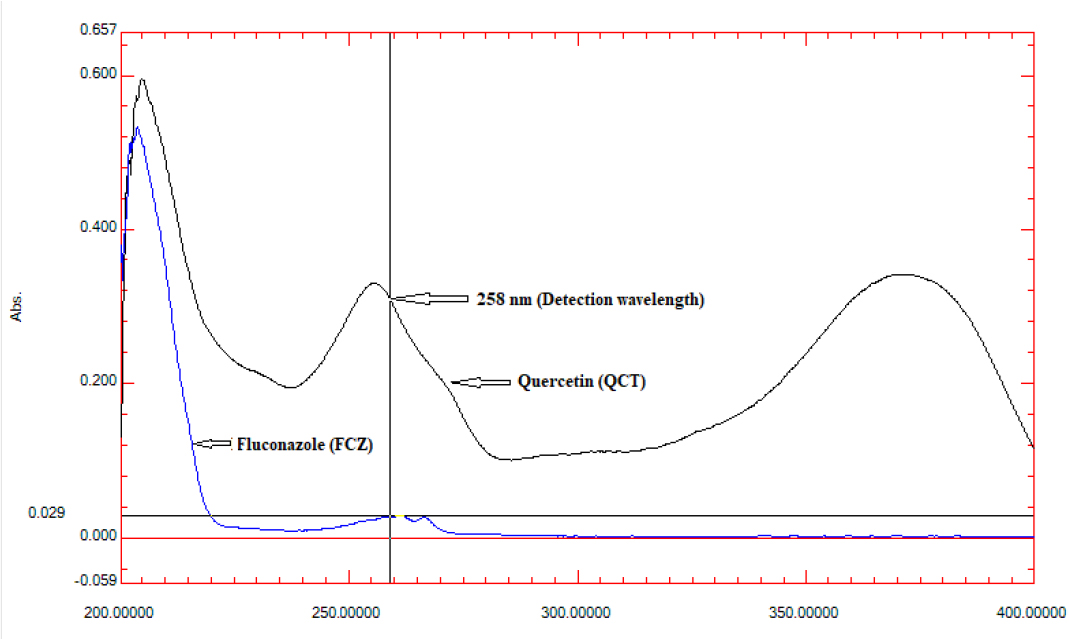
Figure 3:
Zero order overlay spectra of FCZ (10µg/mL) and QCT (10µg/mL) representing common detection wavelength, 258 nm
Mobile Phase optimization
Literature review suggested that one of the RP-HPLC method has been reported for quantification of QCT only, where stationary phase was Inertsil-C18 column (150 x 4.6 mm, 5 µm), while optimized mobile phase contained Methanol-Water- Trifluoroacetic acid (TFA) in the proportion of 70:30:1%, v/v/v, respectively, with mobile phase at flow rate of 0.8 mL/min.21 Different composition of the same mobile phase with different flow rate were tried to achieved retention and separation of FCZ and QCT. Finally, Methanol-Water-Trifluoroacetic acid (TFA) in the proportion of 50:50:1%, v/v/v, respectively, with flow rate of 1.3 mL/min achieved chromatographic separation of both FCZ and QCT as per the requirements of system suitability parameters.
Validation of developed RP-HPLC method
Determination of FCZ and QCT was carried out according to the optimized chromatographic condition as mentioned earlier and the chromatogram of the same is depicted (Figure 4).
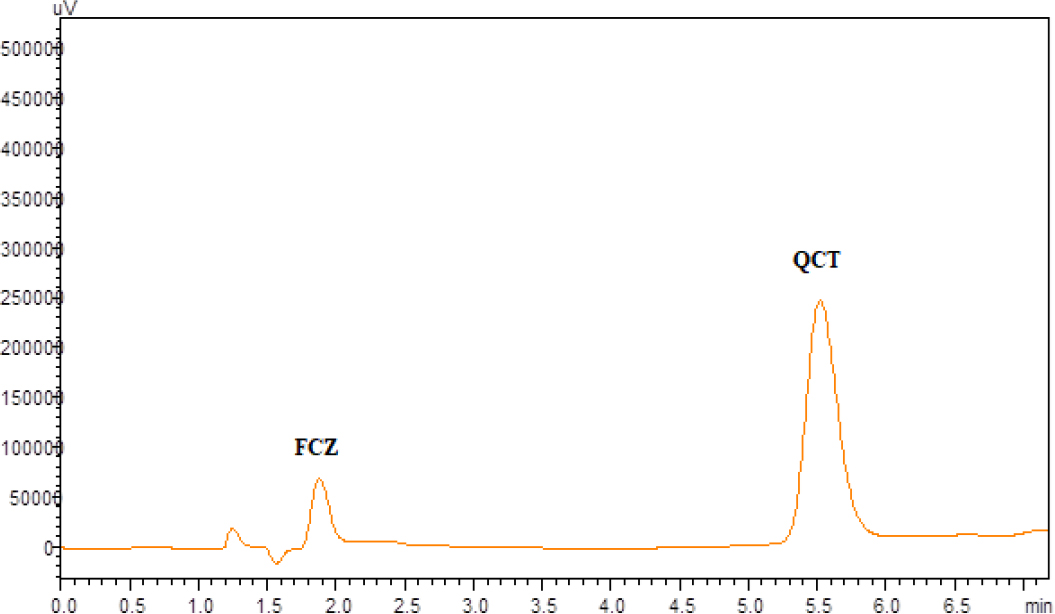
Figure 4:
Typical Chromatogram for FCZ (12µg/mL) (Rt – 1.896) and QCT (3µg/mL) (Rt – 5.637).
System suitability testing (SST) parameters
Before running the sample for the validation parameters, the method was applied for the system suitability testing (SST). The test was performed according to USFDA guidelines. The Chromatographic parameters representing system suitability testing are mentioned in Table 1. The data in the system suitability parameters indicated that the method works well in optimal conditions with % RSD less than 2% (Table 1).
| Concentration of drug (µg/mL) | System Suitability Testing (SST) Parameters | Averagea | SD | % RSD |
|---|---|---|---|---|
| FCZ (12 µg/mL) | Area | 1117955.167 | 4777.91 | 0.4274 |
| Retention Time | 1.883 | 0.01 | 0.5674 | |
| Theoretical Plate | 2458.45 | 17.90 | 0.7282 | |
| Tailing Factor | 1.216 | 0.01 | 1.1942 | |
| QCT (3 µg/mL) | Area | 4057095.333 | 24045.17 | 0.5927 |
| Retention Time | 5.563 | 0.04 | 0.7073 | |
| Resolution | 13.162 | 0.05 | 0.3742 | |
| Theoretical Plate | 3633.85 | 35.20 | 0.9685 | |
| Tailing Factor | 1.310 | 0.01 | 1.0529 |
System suitability testing (SST) parameters.
Linearity and Range
Plotting peak area versus drug concentration determined the method’s linearity. Figure 5 shows the linearity data for FCZ between 4 and 20 µg/ml, whereas Figure 6 shows the same data for QCT between 1 and 5 µg/ml (Table 2), indicating a good correlation between method responses over the concentration range. The linear regression parameters of FCZ and QCT are mentioned in Table 3. The χ2 value for the response of peak area for both compounds were smaller than the tabulated value, confirming the homoscedasticity of the variance as determined by Bartlett’s test (Table 3).
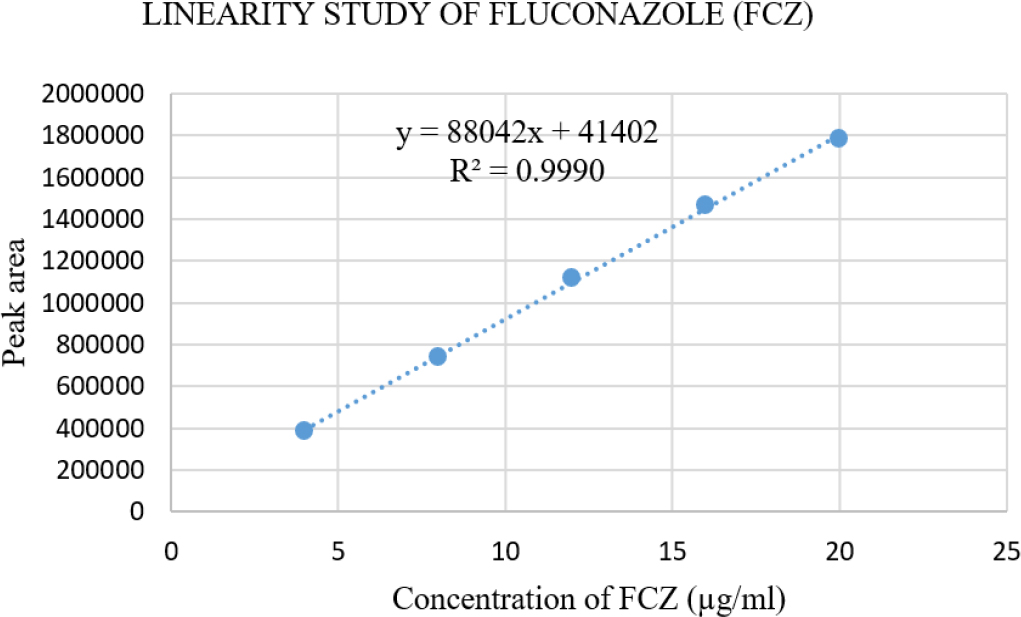
Figure 5:
Calibration Curve for Fluconazole (FCZ) (4 to 20 μg/mL).
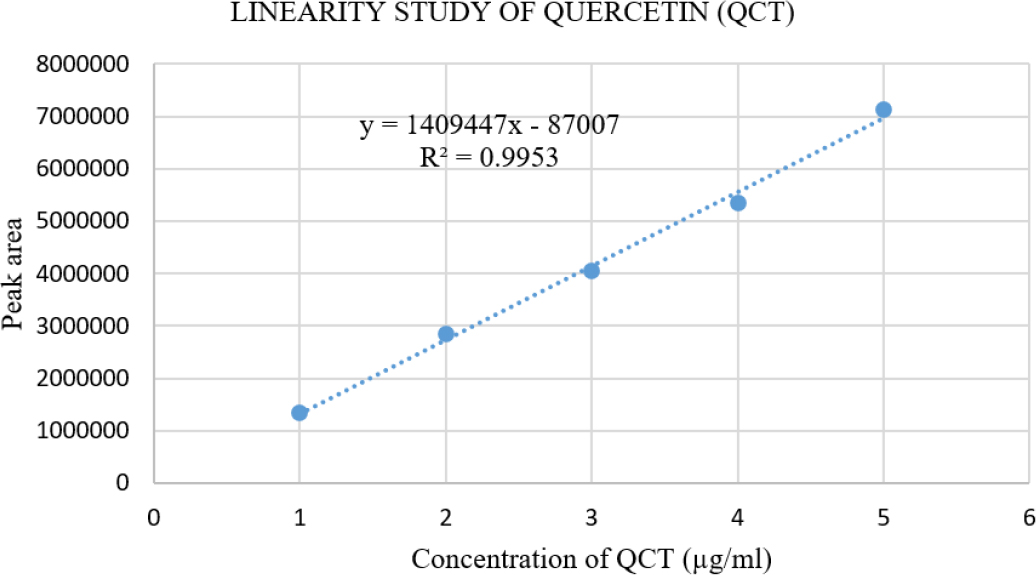
Figure 6:
Calibration Curve for Quercetin (QCT) (1 to 5 μg/mL).
| FCZ | QCT | ||||||
|---|---|---|---|---|---|---|---|
| Conc. of FCZ (µg/mL) | Peak areaa | SD | %RSD | Conc. of QCT (µg/mL) | Peak areaa | SD | %RSD |
| 4 | 385179.40 | 798.95 | 0.2074 | 1 | 1346978.4 | 2122.69 | 0.1576 |
| 8 | 737636.20 | 1300.32 | 0.1763 | 2 | 2834162.8 | 7226.53 | 0.2550 |
| 12 | 1118842.60 | 4756.99 | 0.4252 | 3 | 4039780.2 | 12685.00 | 0.3140 |
| 16 | 1466105.20 | 7968.33 | 0.5435 | 4 | 5348911.4 | 34653.75 | 0.6479 |
| 20 | 1781794.6 | 11054.16 | 0.6204 | 5 | 7136838.8 | 46228.99 | 0.6478 |
Linearity study of FCZ and QCT.
| Parameter | FCZ | QCT |
|---|---|---|
| Linearity Range (µg/mL)a | 4-20 | 1-5 |
| Linear Regression Equation | Y=88042x + 41402 | Y = 1409447x-87007 |
| Correlation Coefficient (R2) | 0.9990 | 0.9953 |
| Average of Intercept | 41402 | -87007 |
| Average of Slope | 88042 | 1409447 |
| Bartlett’s test (χ2)b | 0.00086849 | 0.00174991 |
| LOD (µg/mL) | 0.1835 | 0.0484 |
| LOQ (µg/mL) | 0.5562 | 0.1468 |
| Precision (% RSD) | ||
| Interday Precisionc | 0.3971 – 0.6640 | 0.4958 – 0.9801 |
| Intraday Precisiond | 0.2495 – 0.5757 | 0.2071 – 0.6104 |
| Repeatability Studye | 0.3331 | 0.2070 |
| Accuracy (%Mean Recoveryf ± SD, % RSD) | ||
| 50% | 102.14 ± 0.99, 0.9712 | 98.69 ± 0.26, 0.2680 |
| 100% | 101.1 ± 0.58, 0.5749 | 98.96 ± 0.08, 0.0866 |
| 150% | 99.04 ± 0.07, 0.0729 | 101.66 ± 1.07, 1.0555 |
Linear Regression Parameters and Method Validation Parameters for FCZ and QCT.
Sensitivity (LOD and LOQ)
FCZ had LOD and LOQ values of 0.1835 and 0.5562 μg/mL, whereas QCT had 0.0484 and 0.1468 µg/mL. The data demonstrates the high sensitivity of the method (Table 3).
Precision
The % RSD values for intraday precision, interday precision, and repeatability study were found to be less than 2% for both FCZ and QCT which confirmed the method precision. The method precision data for FCZ and QCT are mentioned in Table 3.
Accuracy
Target concentrations of FCZ (8 µg/mL), and QCT (2 µg/mL) were examined for accuracy at levels of 50%, 100%, and 150%. The data mentioned in Table 3 indicated that %Mean recovery for FCZ was found between 99.04% – 102.14% and for QCT it was found between 98.69% to 101.66% (Table 3). The good recovery of FCZ and QCT indicated the accuracy of the method.
Specificity
The chromatograms of the blank, sample, and drug standard solution were compared to establish the specificity study of the suggested HPLC method. The method only quantified FCZ and QCT analytes without any interferences.
Robustness
An attempt was made to observe the changes in system suitability parameters upon minute changes in mobile phase composition (change in methanol content), Trifluoroacetic acid content, flow rate, and wavelength of detection. The SST data mentioned (Table 4), and the data indicated that in each parameter, the %RSD value was less than 2%,
| Drug | % RSD for Rt* | % RSD for Peak area* | % RSD for Tailing factor* | % RSD for Theoretical Plate* | ||||
|---|---|---|---|---|---|---|---|---|
| Modification in Mobile Phase composition (±1 mL Methanol Content) | ||||||||
| mL | 49 | 51 | 49 | 51 | 49 | 51 | 49 | 51 |
| FCZ | 0.4563 | 0.4103 | 0.2696 | 0.2539 | 0.3361 | 0.2519 | 0.7068 | 0.9040 |
| QCT | 0.7293 | 0.4534 | 0.1965 | 0.2177 | 0.4636 | 0.4924 | 0.9471 | 0.7693 |
| Modification in Trifluoroacetic acid content (± 0.1 mL Trifluoroacetic acid Content) | ||||||||
| mL | 0.9 | 1.1 | 0.9 | 1.1 | 0.9 | 1.1 | 0.9 | 1.1 |
| FCZ | 0.4285 | 0.3584 | 0.1987 | 0.2674 | 1.0488 | 0.6789 | 1.5031 | 1.2556 |
| QCT | 0.4063 | 0.3925 | 0.2643 | 0.3593 | 1.4223 | 0.7820 | 1.2335 | 1.5928 |
| Modification in flow rate of mobile phase (± 0.1 mL/min flow rate) | ||||||||
| mL/min | 1.2 | 1.4 | 1.2 | 1.4 | 1.2 | 1.4 | 1.2 | 1.4 |
| FCZ | 0.3297 | 0.3463 | 0.2125 | 0.1678 | 0.9172 | 0.3463 | 0.6864 | 1.3199 |
| QCT | 0.3771 | 0.4188 | 0.2909 | 0.1742 | 1.2128 | 0.9420 | 1.0213 | 0.7735 |
| Modification in Detection Wavelength (± 2 nm Detection Wavelength) | ||||||||
| nm | 256 | 260 | 256 | 260 | 256 | 260 | 256 | 260 |
| FCZ | 0.2373 | 0.1413 | 0.1057 | 0.1056 | 0.3325 | 0.4983 | 0.9455 | 0.6745 |
| QCT | 0.1780 | 0.1628 | 0.3379 | 0.3438 | 0.2688 | 0.2673 | 0.7221 | 0.8981 |
Robustness data of FCZ and QCT.
Analysis of the formulation
The FCZ and QCT from its newly developed mucoadhesive in situ vaginal gel were quantified using the developed HPLC method, where % Mean recovery for FCZ was found to be in the range of 99.98 to 101.79%, while in QCT it was found to be in the range of 98.20% to 100.57% (Table 5). The good recovery data suggested that the proposed method can be applied for the quantification of FCZ and QCT from newly developed mucoadhesive in situ vaginal gel without excipients interference.
| Drug | Conc. of Drug (µg/mL) | %Mean Recovery* ± SD | % RSD |
|---|---|---|---|
| FCZ | 8 | 99.98 ± 0.37 | 0.3700 |
| 12 | 101.79 ± 0.55 | 0.5396 | |
| 16 | 100.77 ± 0.70 | 0.6899 | |
| QCT | 2 | 100.57 ± 1.08 | 1.0752 |
| 3 | 98.32 ± 0.72 | 0.7314 | |
| 4 | 98.20 ± 0.66 | 0.6707 |
Assay data of FCZ and QCT.
CONCLUSION
In the proposed developed and validated HPLC method, water and methanol constitute the majority of the mobile phase, making the overall chromatographic testing cost relatively inexpensive. The excipients of the formulation did not interfere with the detection of the individual analytes in the investigation, so the recommended HPLC method can be used to precisely quantify FCZ and QCT from its newly developed mucoadhesive in situ vaginal gel formulation. The proposed method is also sensitive, reliable, precise, accurate, and robust because it satisfies all prerequisites recommendations made by ICHQ2(R1) guidelines.
References
- Kelly BP. Superficial fungal infections. Pediatr Rev.. 2012;33(4):e22-37. [PubMed] | [CrossRef] | [Google Scholar]

- Brown GD, Denning DW, Gow NAR, Levitz SM, Netea MG, White TC, et al. Hidden killers: human fungal infections. Sci Transl Med.. 2012;4(165):165rv13 [PubMed] | [CrossRef] | [Google Scholar]

- Achkar JM, Fries BC. Candida infections of the genitourinary tract. Clin Microbiol Rev. 2010;23(2):253-73. [PubMed] | [CrossRef] | [Google Scholar]

- Zavrel M, White TC. Medically important fungi respond to azole drugs: an update. Future Microbiol. 2015;10(8):1355-73. [PubMed] | [CrossRef] | [Google Scholar]

- Sarkar S, Uppuluri P, Pierce CG, Lopez-Ribot JL. Array. Antimicrob Agents Chemother.. 2014;58(2):1183-86. [PubMed] | [CrossRef] | [Google Scholar]

- Han S, Kim J, Yim H, Hur J, Song W, Lee J, et al. Population pharmacokinetic analysis of fluconazole to predict therapeutic outcome in burn patients with Candida infection. Antimicrob Agents Chemother. 2013;57(2):1006-11. [PubMed] | [CrossRef] | [Google Scholar]

- Fiori A, Van Dijck PV. Potent synergistic effect of doxycycline with fluconazole against is mediated by interference with iron homeostasis. Antimicrob Agents Chemother. 2012;56(7):3785-96. [PubMed] | [CrossRef] | [Google Scholar]

- Ying C, Zhang H, Tang Z, Chen H, Gao J, Yue C., et al. Antifungal susceptibility and molecular typing of 115 isolates obtained from vulvovaginal candidiasis patients in 3 shanghai maternity hospitals. Med Mycol.. 2016;54(4):394-99. [PubMed] | [CrossRef] | [Google Scholar]

- Shi X, Yang Y, Zang Y, Li W, Wang J, Huang W, Fan Y., et al. Molecular identification and antifungal susceptibility of 186 candida isolates from vulvovaginal candidiasis in southern china. J Med Microbiol.. 2015;64(4):390-93. [PubMed] | [CrossRef] | [Google Scholar]

- Youngsaye W, Hartland CL, Morgan BJ, Ting A, Nag PP, Vincent B, et al. ML212: A small-molecule probe for investigating fluconazole resistance mechanisms in . Beilstein J Org Chem.. 2013;9:1501-7. [PubMed] | [CrossRef] | [Google Scholar]

- Angiolella L, Stringaro AR, De Bernardis F, Posteraro B, Bonito M, Toccacieli L, et al. Increase of virulence and its phenotypic traits in drug-resistant strains of . Antimicrob Agents Chemother.. 2008;52(3):927-36. [PubMed] | [CrossRef] | [Google Scholar]

- Yu LH, Wei X, Ma M, Chen XJ, Xu SB. Possible inhibitory molecular mechanism of farnesol on the development of fluconazole resistance in biofilm. Antimicrob Agents Chemother. 2012;56(2):770-75. [PubMed] | [CrossRef] | [Google Scholar]

- Singh BN, Upreti DK, Singh BR, Pandey G, Verma S, Roy S, et al. Quercetin sensitizes fluconazole-resistant to induce apoptotic cell death by modulating quorum sensing. Antimicrob Agents Chemother. 2015;59(4):2153-68. [PubMed] | [CrossRef] | [Google Scholar]

- Shahzad M, Sherry L, Rajendran R, Edwards CA, Combet E, Ramage G., et al. Utilising polyphenols for the clinical management of biofilms. Int J Antimicrob Agents. 2014;44(3):269-73. [PubMed] | [CrossRef] | [Google Scholar]

- Gao M, Wang H, Zhu. L.. Quercetin Assists Fluconazole to Inhibit Biofilm formations of Fluconazole Resistant in and Antifungal Managements of Vulvovaginal Candidiasis. Cell Physiol Biochem. 2016;40(3-4):727-42. [PubMed] | [CrossRef] | [Google Scholar]

- [PubMed] | [CrossRef] | [Google Scholar]

- United States Pharmacopeia 27, national formulary 22. The United States Pharmacopeial Convention, Rockville. Vol. 2. 2003:2281 [PubMed] | [CrossRef] | [Google Scholar]

- [PubMed] | [CrossRef] | [Google Scholar]

- [PubMed] | [CrossRef] | [Google Scholar]

- Annapurna MM, Mohapatro C, Narendra A.. Stability-indicating liquid chromatographic method for the determination of letrozole in pharmaceutical formulations. J Pharm Anal. 2012;2(4):298-305. [PubMed] | [CrossRef] | [Google Scholar]

- D’mello PM, Joshi UJ, Shetgiri PP, Dasgupta TK, Darji KK. A Simple HPLC Method for Quantitation of Quercetin in Herbal Extracts. J. AOAC Int. 2011;94(1):100-05. [PubMed] | [CrossRef] | [Google Scholar]

