ABSTRACT
Objectives
For the quantification of rivastigmine in both its pure form and pharmaceutical formulation, an ultra-performance liquid chromatography method with high speed and sensitivity was created and validated.
Materials and Methods
Acquity UPLC BEH C8 (100 mm x 2.1 mm and 1.7 μm) employed to resolve the analysis, and the mobile phase included ammonium phosphate buffer and acetonitrile in a 65:35% v/v ratio. The column temperature was 30°C. The volume of sample injected was 10 μL. The flow rate was 0.5 mL/min, and UV detection was used to detect the analyte at 254 nm.
Results
As there was no interferences observed by blank and placebo at the retention time of rivastigmine. According to the results of the degradation investigation, considerable degradation was seen under the conditions of alkali and oxidative stress (peroxide). This led to the conclusion that rivastigmine was susceptible to oxidation and alkali. A study using six replicate injections was carried out to obtain system precision. The predicted % RSD from the rivastigmine peak locations was determined to be 0.2%. The correlation coefficient was determined to be 0.9996, and the suggested UPLC method was linear over the range of 12.5 to 75 g/mL. The accuracy studies were displayed as a % recovery for rivastigmine levels between 50% to 150%. The results obtained were determined to be within the limits, and the maximum percentage of recovery revealed was in between 98 and 102%. As a result, the accuracy of the technique was established. The procedure remains unaffected by variations in column oven temperature and wavelength. All the validation parameters satisfy the ICH Q2 specification acceptance limits, and the technique was validated in accordance with ICH rules.
Conclusion
According to ICH criteria, the developed technique was verified for several parameters including accuracy, precision, linearity, specificity, system compatibility, solution stability, and robustness. The results obtained met the requirements for acceptance. It was determined, then, that the proposed UPLC technology was easy to use, precise, and accurate, and that it can be successfully used for the routine analysis of rivastigmine in bulk and pharmaceutical dosage forms.
INRODUCTION
Rivastigmine was chemically named as 3-[(1S)-1- (dimethyl amino) ethyl] phenyl N-ethyl-N-methylcarbamate. The molecular formula was C14H22N2O2 with molecular weight: 250.33 g/mol. In patients with Alzheimer’s and Parkinson’s disease, rivastigmine, a parasympathomimetic or cholinergic drug, was used to prevent and cure neurodegenerative disease, particularly dementia.1 Rivastigmine was a carbamate derivative, unlike donepezil and tacrine, that shares no structural similarities with physostigmine.
The mechanism of rivastigmine was still unknown, however it was hypothesized that it binds to and inactivates cholinesterase (such as acetylcholinesterase and butyrylcholinesterase), blocking the hydrolysis of acetylcholine and increasing the amount of acetylcholine at cholinergic synapses.2 Rivastigmine’s anticholinesterase activity was more selective for brain acetylcholinesterase than for those in peripheral tissues.3 Figure 1 represents the rivastigmine chemical structure.
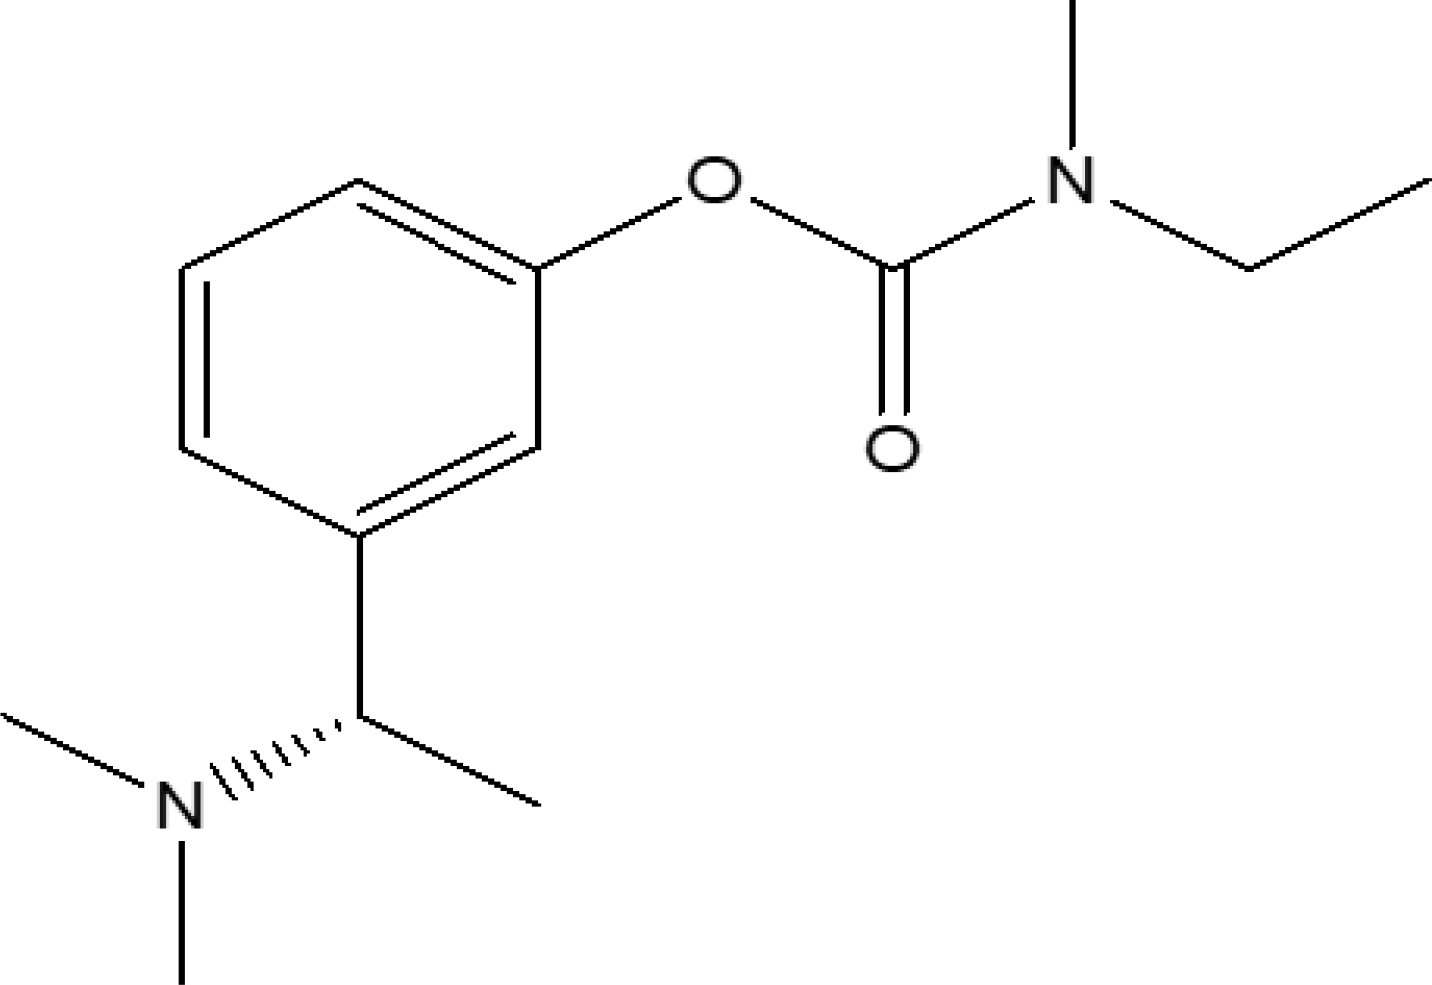
Figure 1:
Structure of rivastigmine.
According to the literature survey, HPLC,4,5 UV6–8 and LC-MS/MS9–11 methods were reported for quantification of rivastigmine. The purpose of this work was to develop a novel, specific, and accurate UPLC technique for the determination of rivastigmine both in its pure form and in capsule dosage form in compliance with ICH standards.
MATERIALS AND METHODS
Chemicals and reagents
Chandra Labs (Hyderabad) provided a free sample of rivastigmine. The chemicals used in the experiment included methanol and potassium di hydrogen orthophosphate (Merck Life Science Private Limited). Acetonitrile (Avantor Performance Materials India Limited), and disodium hydrogen phosphate (Thermo Fisher Scientific India Pvt. Ltd.) were also used in the experiment. Distilled water was prepared in the laboratory.
Instruments and Equipment
Shimadzu 1200 UPLC column system (Open Lab EZ Chrome software) equipped with quaternary pumps, and a photodiode array detector was used. A pH meter (Thermo scientific) was used to determine the pH levels. Analytical balance (Mettler Toledo) was used for all analytical measurements.
Method of Analysis
Preparation of ammonium buffer (pH 3.5)
3.0 g of ammonium phosphate was accurately weighed and added to 1 L of water. The solution was dissolved by sonication. The pH was modified by diluted orthophosphoric acid and filtered via 0.45 µm thickness of membrane filter paper.12
Preparation of mobile phase
The mobile phase was made by combining 350 mL of acetonitrile and 650 mL of buffer. The gas was eliminated by sonicating the solution. A 0.45 µm membrane filter paper was used to filter mobile phase.
Preparation of stock solutions
50 mg of rivastigmine was precisely weighed and transferred into 50 mL volumetric flask. The volume was made using mobile phase.
Preparation of working standard solutions
From the above stock solution, 100 µg/mL of rivastigmine was prepared by transferred 5 mL of the stock solution into 50 mL of a volumetric flask. The volume was made up with mobile phase respectively.
Preparation of sample solution
The weight of the 20 capsules was recorded, and the powder was collected in a plastic bag.
The empty capsule shells were weighed, and the average weight of the full powder was calculated by the formula below.
- 20 capsules powder weight = (20 capsules weight with filled powder – weight of the capsule shells without filled powder)
The average weight was determined. Rivastigmine powder corresponding to 10 mg of the drug was precisely measured and transferred into a 100 mL volumetric flask. To the volumetric flask, 70 mL of mobile phase was added and sonicated for 20 min to get dissolved.
For 10 min, the sample solution was centrifuged at 5000 rpm and the volume was adjusted with the mobile phase.
Preparation of placebo solution
Placebo powder was weighed equivalent to 10 mg of rivastigmine and transferred into 100 mL of volumetric flask. 70 mL of mobile phase was added and sonicated for 20 min to get dissolved.
For 10 min, the sample solution was centrifuged at 5000 rpm and the volume was adjusted with the mobile phase.
Instrumentation
The method development and validation of UPLC was carried out on an Acquity UPLC BEH C8 (100 mm x 2.1 mm and 1.7 µm), with mobile phase was composed of ammonium phosphate buffer and acetonitrile in the ratio of (65:35% v/v), and flow rate of 0.5 mL/min. The column temperature was 30°C. The volume of sample injected was 10 µL. From the UV spectrum of rivastigmine, 254 nm was chosen as a wavelength. The eluted compounds were monitored at 254 nm. The chromatographic conditions were illustrated in Table 1 and the optimized chromatogram was represented in Figure 2.

Figure 2:
Optimized chromatogram of rivastigmine.
| Parameter | Chromatographic conditions |
|---|---|
| Stationary phase | Acquity UPLC BEH C8 (100 mm×.2.1 mm and 1.7 μm) |
| Mobile phase | Ammonium phosphate buffer pH 3.5: acetonitrile 65:35% (v/v) |
| Injection volume | 5 μL |
| Total run time | 10 min |
| Detector | Photodiode array detector |
| Elution | Isocratic mode |
| Flow rate | 0.5 mL/min |
| λmax | 254 nm |
RESULTS
Method expansion and optimization of chromatographic conditions
UV-spectroscopic analysis of rivastigmine drug substance showed UV absorbance (λmax) at 254 nm correspondingly.
A simple and robust UPLC technique was developed for the determination of rivastigmine in its pure and in capsules dosage form, dissimilar mobile phases and columns were employed to achieve a good peak shape.
The technique expansion (first trial) was started with Acquity BEH C18 (100 mm×2.1mm and 1.7 µm) with the mobile phase composition of ammonium acetate pH 4.0 buffer: methanol in the proportion of 70:30 v/v. It was examined that peak shape was not good. The column stationary phase was not appropriate for the component. The second trial was performed by change in the column Acquity BEH phenyl (100 mm×.2.1 mm and 1.7 µm). The rivastigmine was eluted at void volume and the peak shape was not good. The third trial was performed by change in the mobile phase, ammonium phosphate buffer pH 6.0: methanol in the proportion of 70:30 v/v. The rivastigmine was injected, peak shape was good, but eluted at 2.0 min with tailing more than 1.8. The final trial was performed by the column Acquity BEH C8 (100 mm×.2.1mm and 1.7 µm), the mobile phase composed of ammonium phosphate buffer pH 3.5: acetonitrile in the proportion of 65:35 v/v, eluted at 1.5min and peak shape was good and the efficiency was more than 2000 for rivastigmine. Hence this method was optimized. Figure represents the optimized chromatogram of rivastigmine.
System Suitability Parameters
The system’s suitability was assessed by six replicate injections of the drug standard solution (100 µg/mL). Parameters like tailing factor, plate count and column efficiency were noted. Table 2 displayed the data on system suitability parameters.
| Parameter | Observation |
|---|---|
| Retention time | 1.460 min |
| Theoretical plates | 3632.447 |
| Tailing factor | 1.3 |
Specificity
A drug peak response and a placebo response were examined for interference in the obtained chromatograms.13 There was no interference in the placebo or blank samples. Table 3 showed the specificity data and the chromatograms were represented in Figures 3 and 4.

Figure 3:
Chromatogram of blank.

Figure 4:
Chromatogram of placebo.
| Sl. No. | Solution details | Area of rivastigmine |
|---|---|---|
| 1 | Standard | 7524.21 |
| 3 | Blank | Not detected |
| 4 | Placebo | Not detected |
| 5 | Test solution | 7504.21 |
System Precision
Chromatogram data for system precision revealed that % RSD was found to be 0.2. The precision data was shown in the Table 4.
| Name of the Standard | Area of rivastigmine |
|---|---|
| Standard-01 | 7544.39 |
| Standard-02 | 7539.38 |
| Standard-03 | 7506.33 |
| Standard-04 | 7505.25 |
| Standard-05 | 7524.67 |
| Standard-06 | 7525.37 |
| Average | 7524.01 |
| % RSD | 0.2 |
Method precision
Chromatogram data for method precision revealed that the % RSD was found to be 0.8. The precision data for each method was shown in Table 5.
| Sl. No. | Solution details | % Assay of rivastigmine |
|---|---|---|
| 1 | Test solution preparation 1 | 99.6 |
| 2 | Test solution preparation 2 | 99.9 |
| 3 | Test solution preparation 3 | 101.1 |
| 4 | Test solution preparation 4 | 100.4 |
| 5 | Test solution preparation 5 | 99.9 |
| 6 | Test solution preparation 6 | 101.8 |
| Average | 100.5 | |
| Std deviation | 0.81 | |
| % RSD | 0.80 | |
Intermediate precision results
Chromatogram data for intermediate precision revealed that % RSD was found to be 0.5. Table 6 displayed the intermediate precision data.
| Sl. No. | Solution details | % Assay of rivastigmine |
|---|---|---|
| 1 | Test solution preparation 1 | 99.9 |
| 2 | Test solution preparation 2 | 98.5 |
| 3 | Test solution preparation 3 | 99.3 |
| 4 | Test solution preparation 4 | 99.6 |
| 5 | Test solution preparation 5 | 99.8 |
| 6 | Test solution preparation 6 | 99.7 |
| Average | 99.5 | |
| % RSD | 0.5 | |
Ruggedness
The ruggedness chromatogram data revealed that the % RSD was 0.42. Table 7 displayed data on ruggedness.
| Sl. No. | Solution details | % Assay of rivastigmine |
|---|---|---|
| Analyst-01 | Test solution preparation 1 | 99.6 |
| Test solution preparation 2 | 99.9 | |
| Test solution preparation 3 | 101.1 | |
| Test solution preparation 4 | 100.4 | |
| Test solution preparation 5 | 99.9 | |
| Test solution preparation 6 | 101.8 | |
| Analyst-02 | Test solution preparation 1 | 99.9 |
| Test solution preparation 2 | 98.5 | |
| Test solution preparation 3 | 99.3 | |
| Test solution preparation 4 | 99.6 | |
| Test solution preparation 5 | 99.8 | |
| Test solution preparation 6 | 99.7 | |
| Average | 99.9 | |
| Std deviation | 0.47 | |
| % RSD | 0.42 |
Linearity
Linearity was obtained using the suggested UPLC technique at concentrations that range from 50 to 150 µg/mL. The Linearity equation of rivastigmine was found to be y = 107.24x-3163.6, with a correlation coefficient of 0.9996. The linearity data was shown in Table 8 and the calibration data was shown graphically in Figure 5.
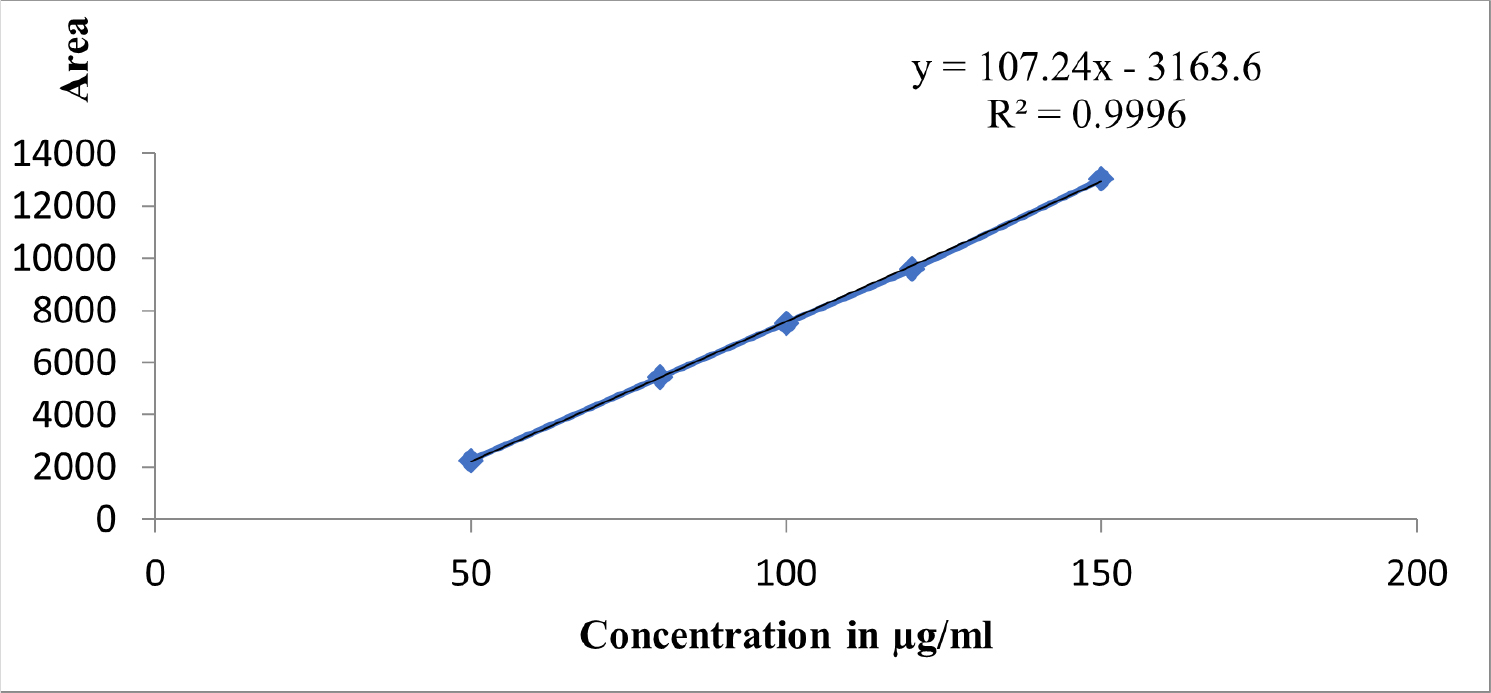
Figure 5:
Linearity graph.
| Sl. No | Concentration (µg/mL) | Name of the solution | Area of rivastigmine |
|---|---|---|---|
| 1 | 50 | Linearity solution, Level-1 | 2245.62 |
| 2 | 80 | Linearity solution, Level-2 | 5429.26 |
| 3 | 100 | Linearity solution, Level-3 (100%) | 7517.5 |
| 4 | 120 | Linearity solution, Level-4 (120%) | 9585.91 |
| 5 | 150 | Linearity solution, Level-5 (150%) | 13022.47 |
| Slope | 107.24 | ||
| Intercept | 3136.3 | ||
| Correlation coefficient | 0.9996 | ||
Accuracy and Recovery
Recovery studies helped to determine the accuracy of the method. The reference standards for the drugs were added to the formulation (pre-analyzed sample) at levels of 50%, 100%, and 150%. The percentage recovery and % mean recovery was computed for the drug that were shown in Table 9.
| Name of the solution | % Recovery of rivastigmine |
|---|---|
| Recovery-50%-01 | 98.1 |
| Recovery-50%-02 | 100.4 |
| Recovery-50%-03 | 100.5 |
| Recovery-100%-01 | 100.9 |
| Recovery-100%-02 | 101.0 |
| Recovery-100%-03 | 99.7 |
| Recovery-150%-01 | 101.0 |
| Recovery-150%-02 | 101.0 |
| Recovery-150%-03 | 100.9 |
| Average | 100.7 |
| Std deviation | 0.96 |
| % RSD | 1.0 |
Sensitivity
LOD and LOQ of rivastigmine were found to be 1.1 µg/mL and 3.4 µg/mL, respectively.
Robustness
Robustness was carried out with 10 µg/mL of rivastigmine and the % RSD was found to be in the range of 0.2-0.9. The results were shown in Table 10.
| Name of the parameter | % RSD | Theoretical plates | Tailing factor |
|---|---|---|---|
| Low column oven temperature(35°C) | 0.2 | 3524 | 1.34 |
| Low column oven temperature(45°C) | 0.9 | 3632 | 1.36 |
| Lower wavelength (249 nm) | 0.8 | 3637 | 1.37 |
| Higher wavelength (269 nm) | 0.7 | 3634 | 1.38 |
Forced Degradation studies
Rivastigmine was degraded by acid (0.6%), alkali (1.2%), oxidation (5.8%), photolytic degradation (1.0%), and thermal degradation (0.5%). The results showed that rivastigmine was more resistant to all the forced degradation conditions tested. The outcomes were shown in Table 11. The chromatograms for acid degradation, basic degradation, oxidation, thermal degradation, and photolytic degradation were enumerated in Figures 6–10. The summary of all the validation parameters was displayed in Table 12.
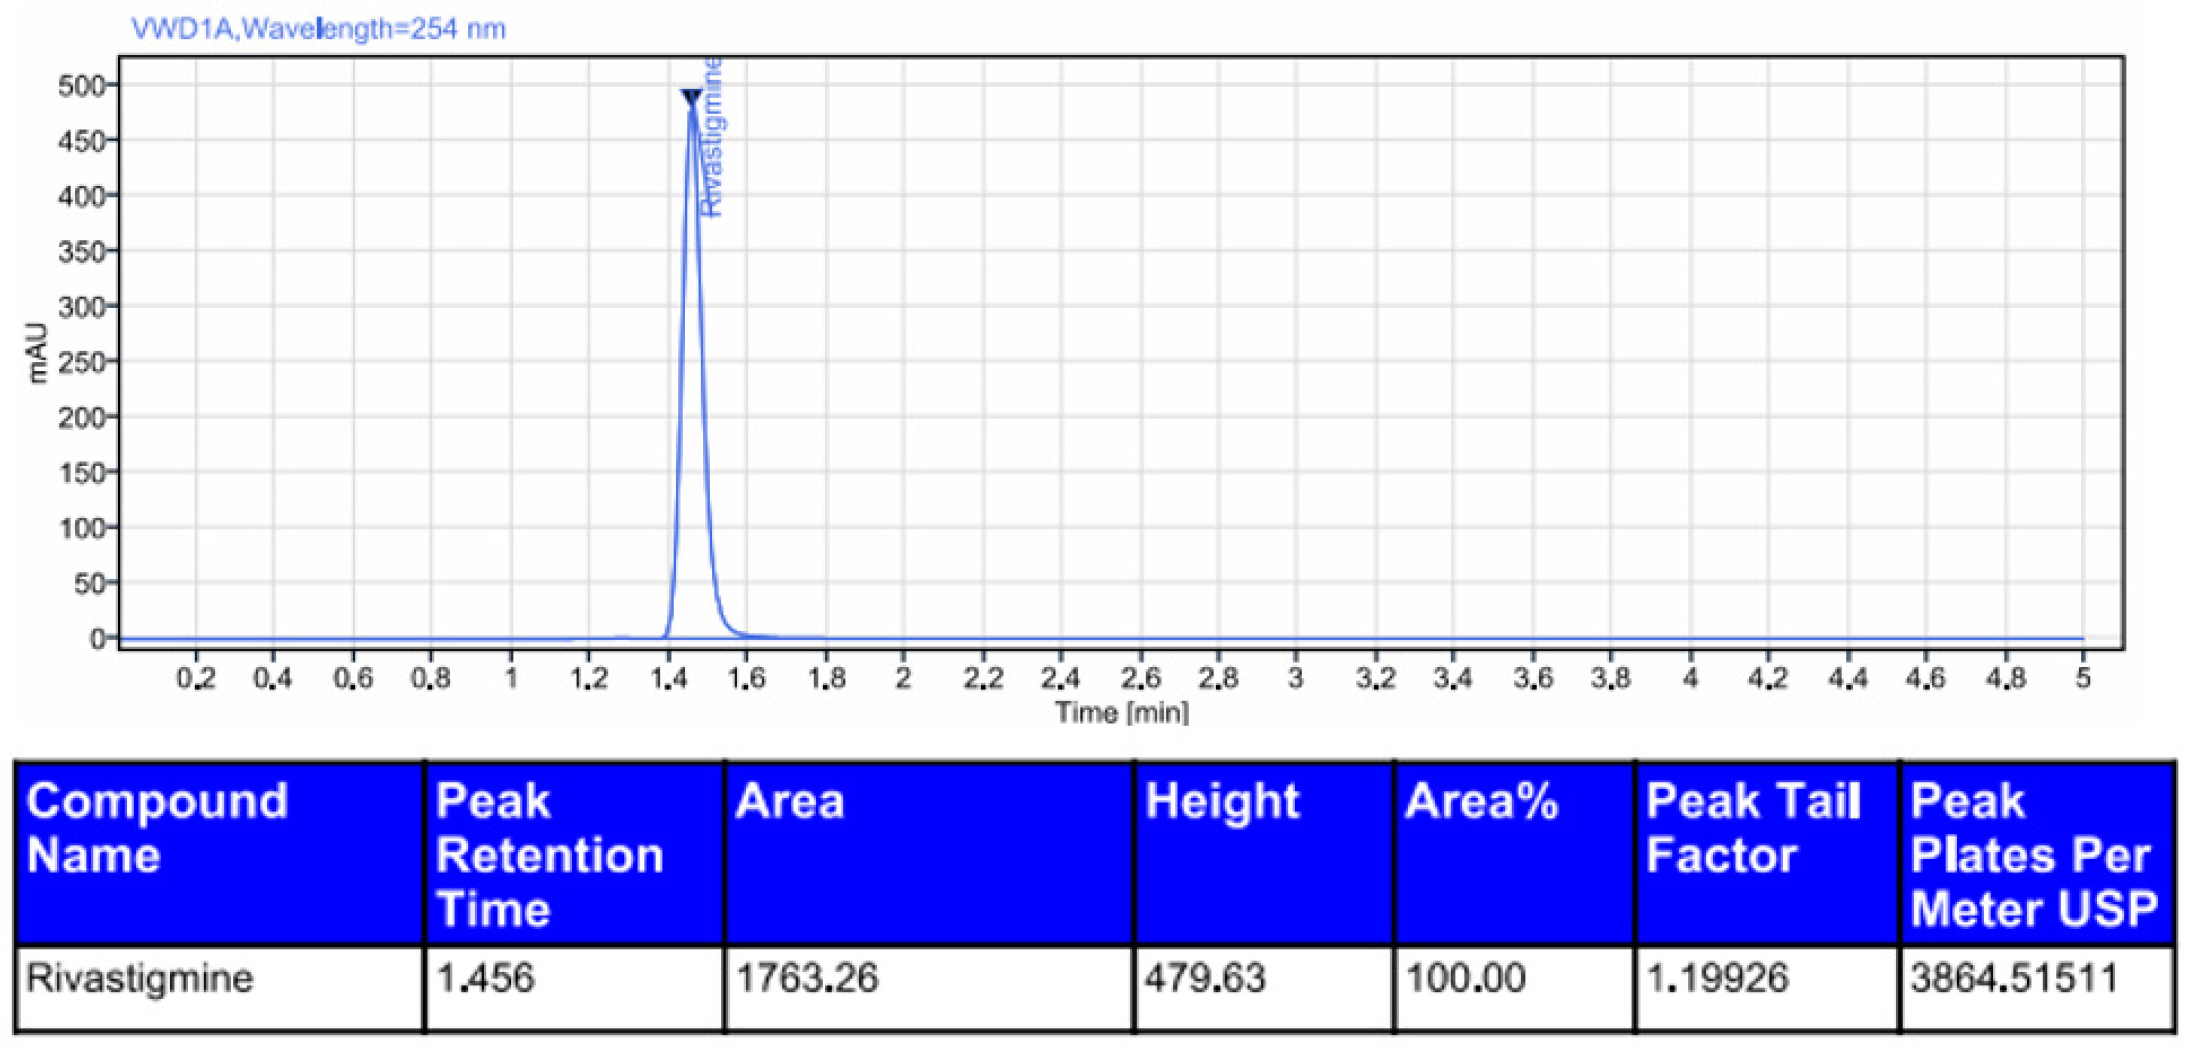
Figure 6:
Chromatogram of acidic degradation of rivastigmine.
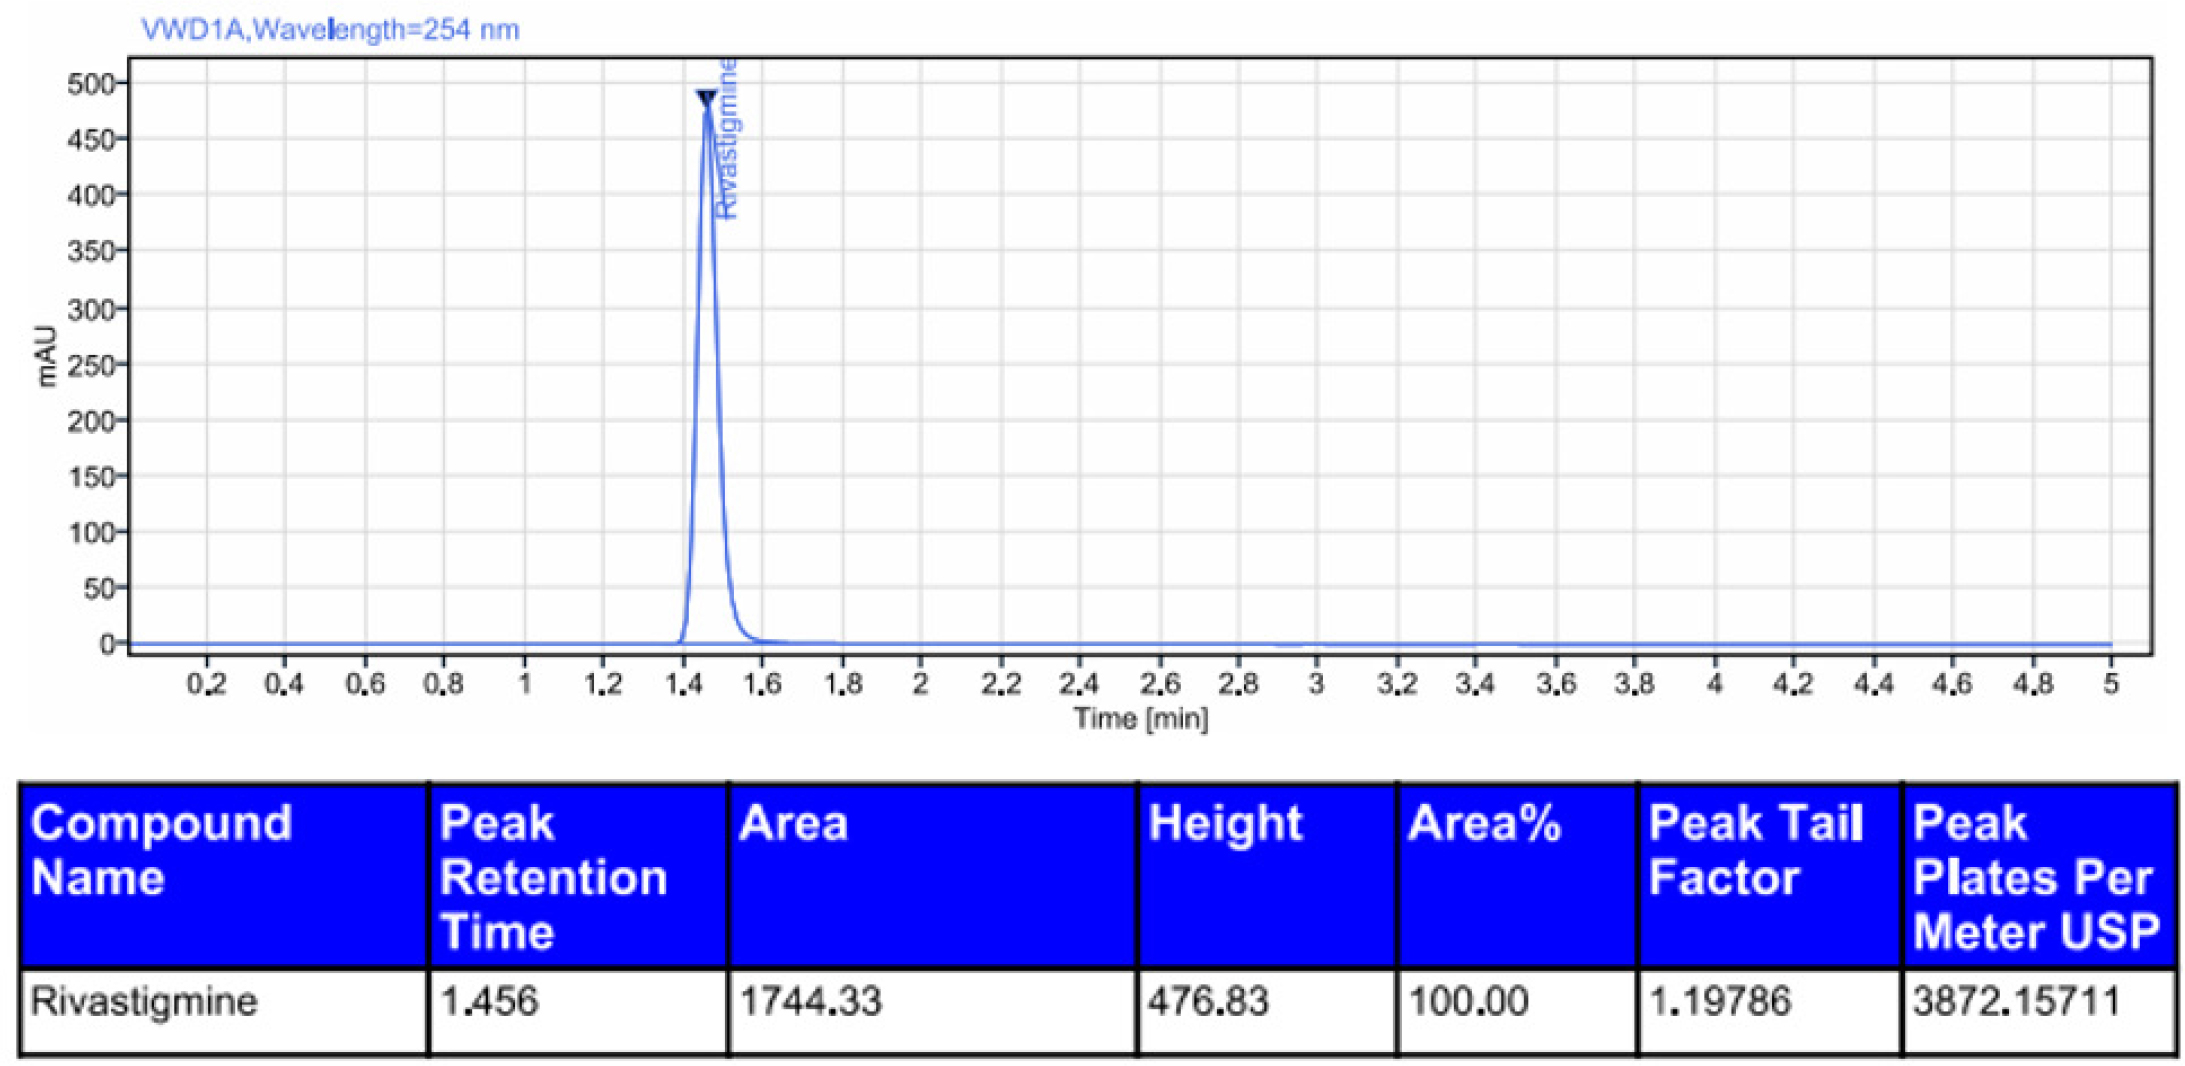
Figure 7:
Chromatogram of basic degradation of rivastigmine.
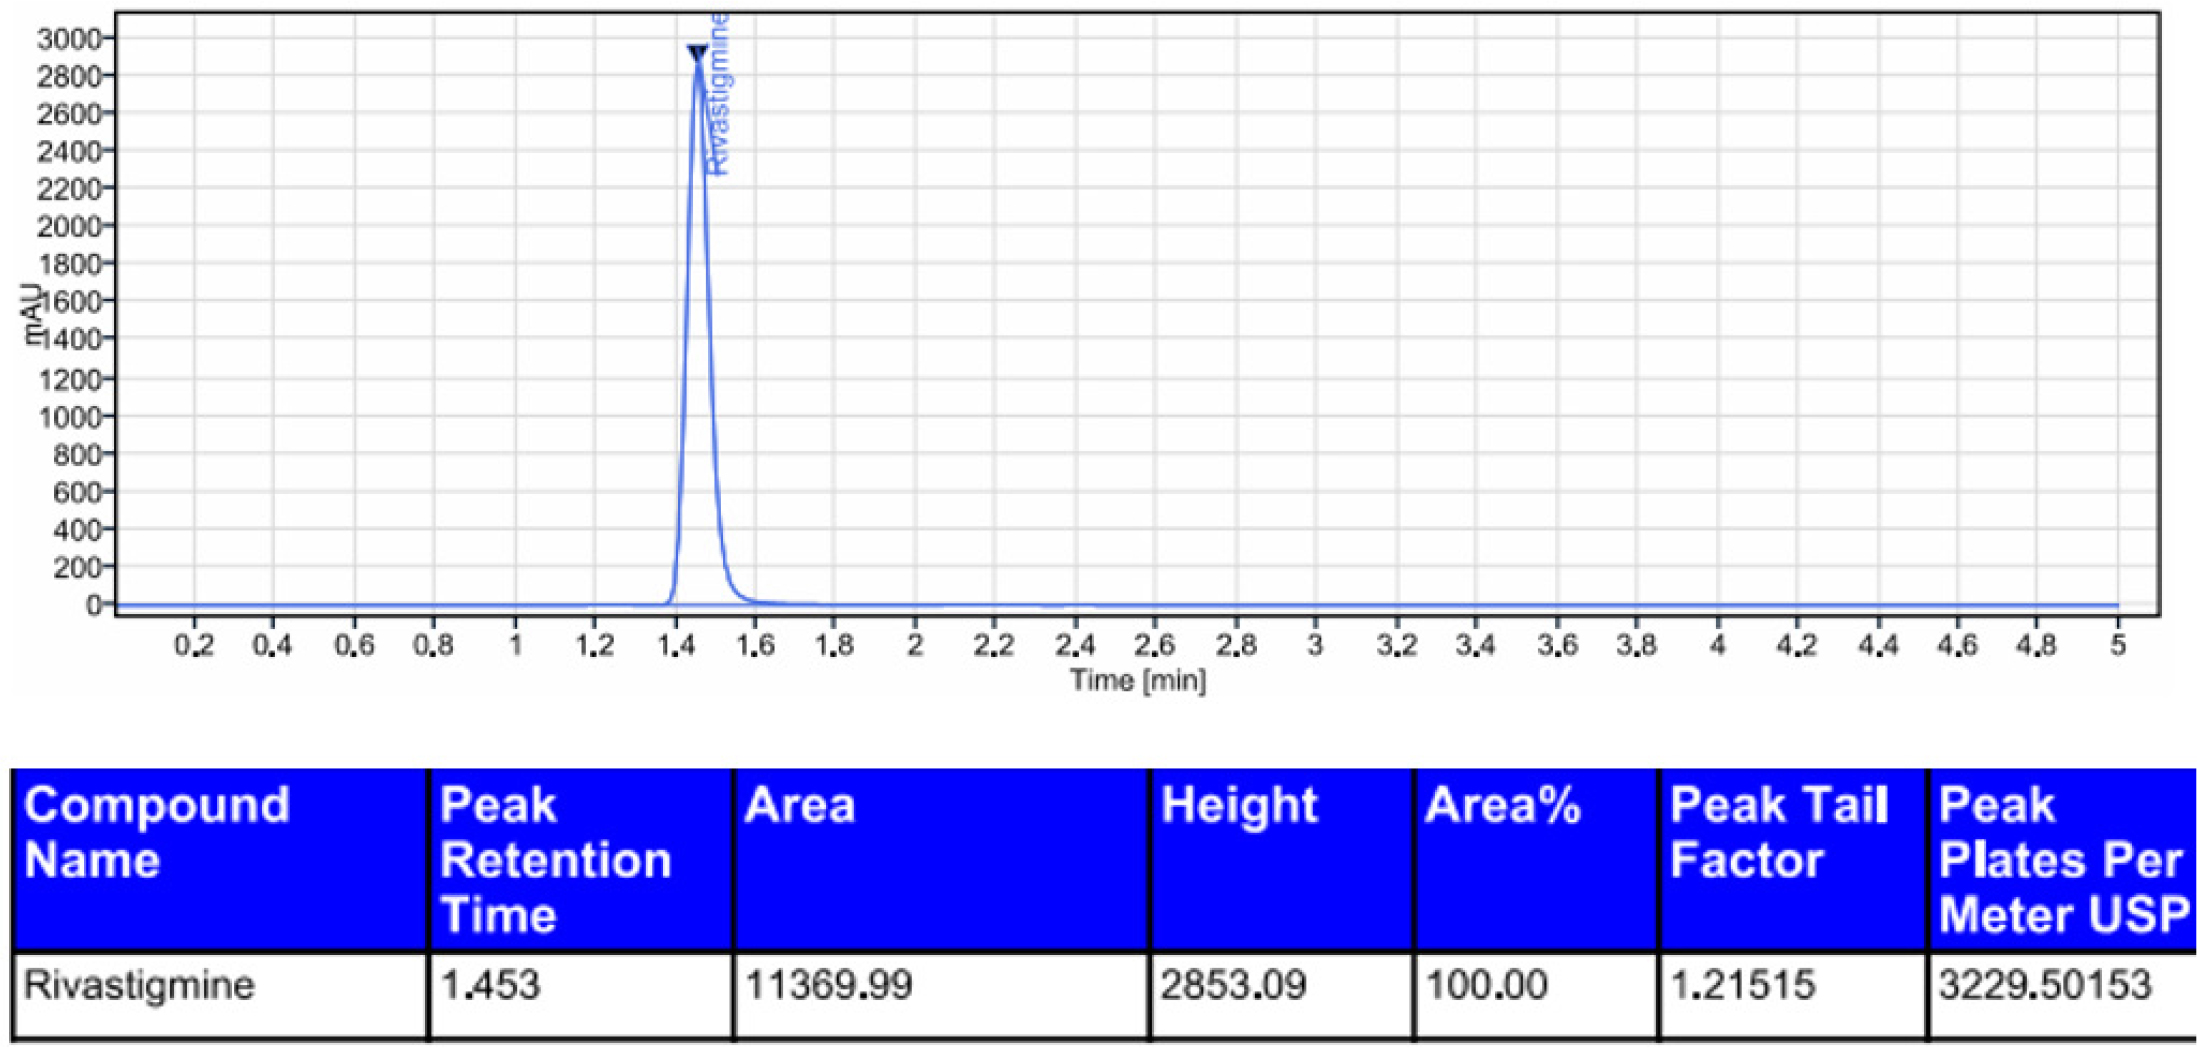
Figure 8:
Chromatogram of peroxide degradation of rivastigmine.
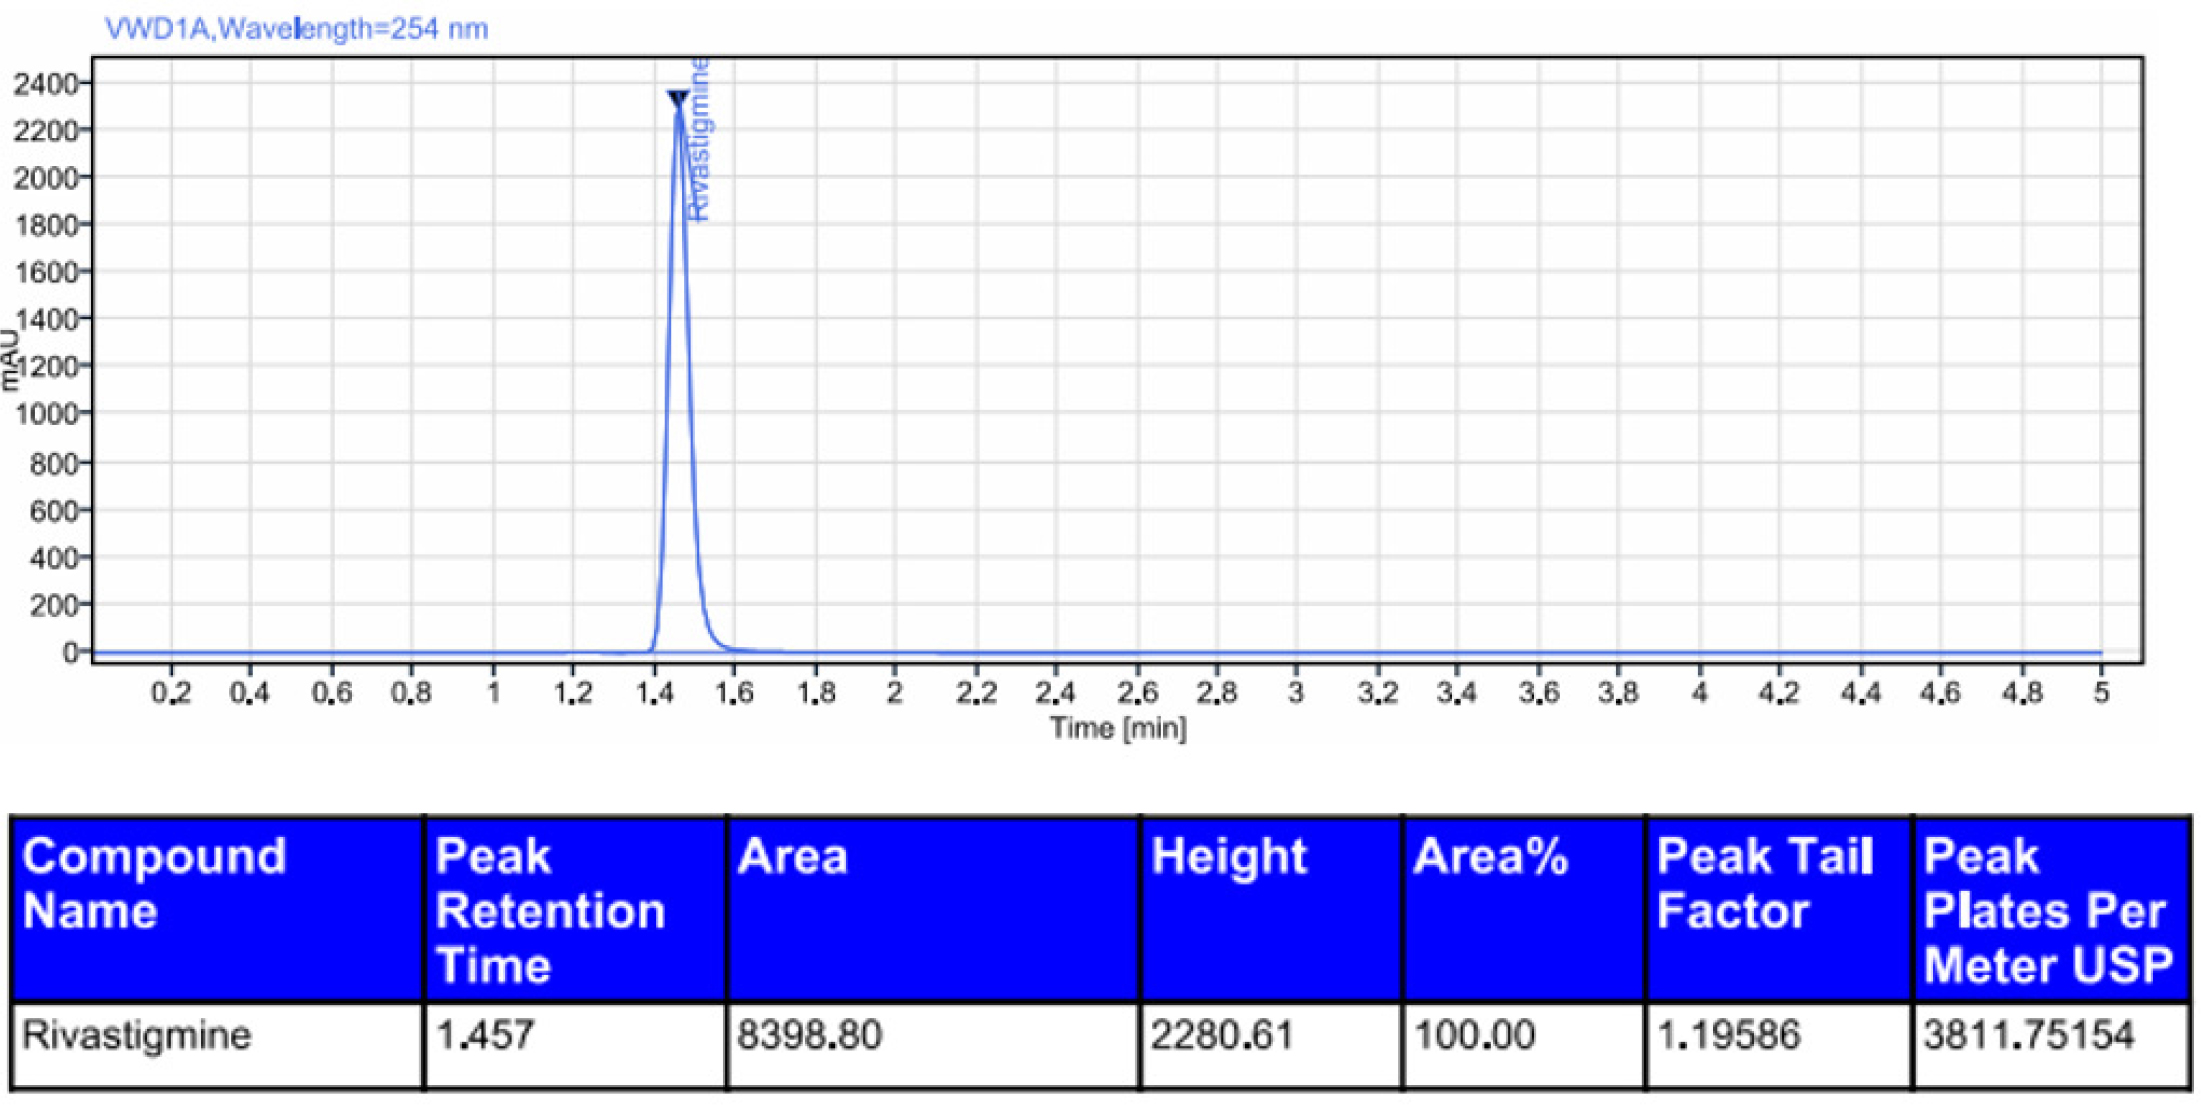
Figure 9:
Chromatogram of photolytic degradation of rivastigmine.
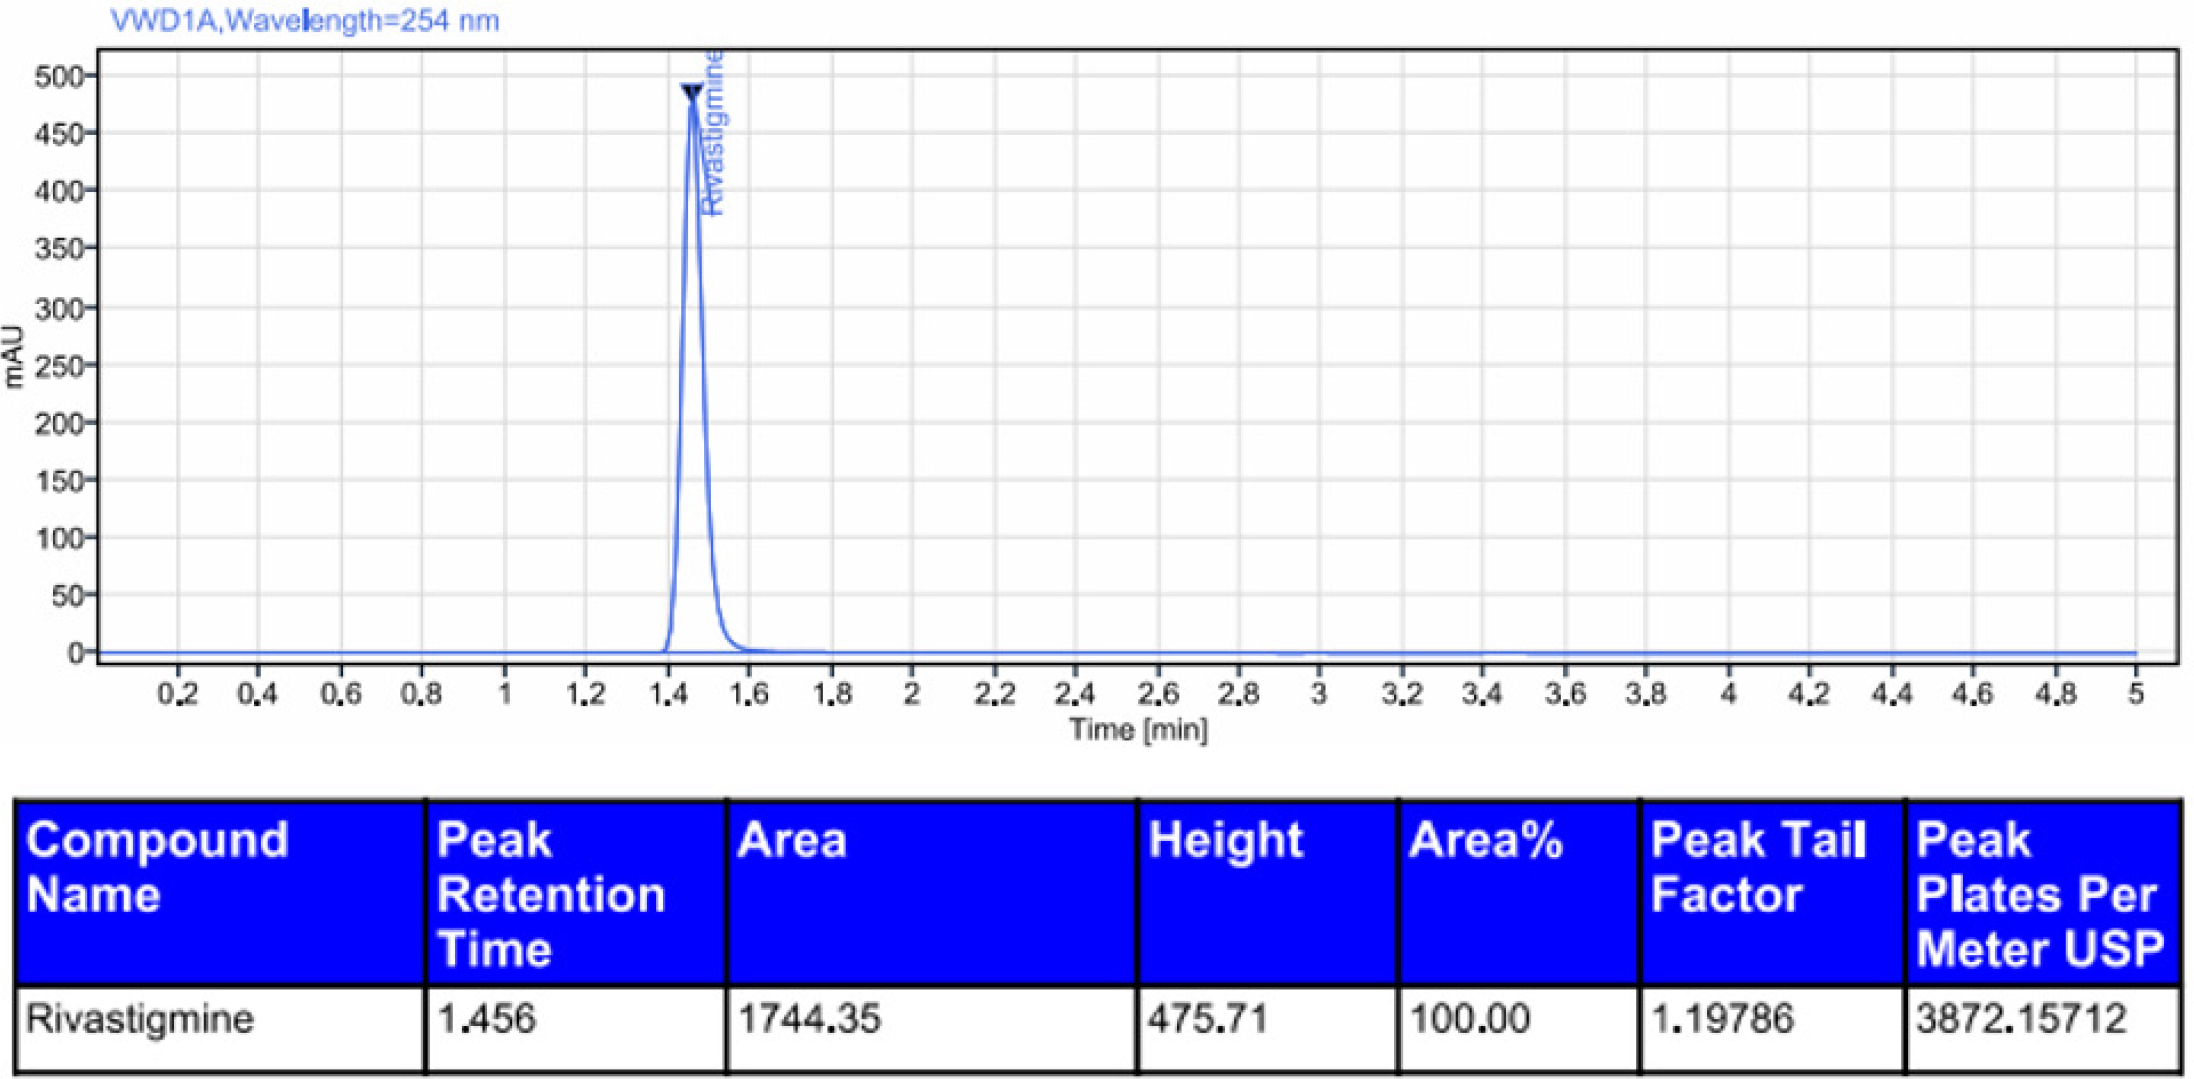
Figure 10:
Chromatogram of thermal degradation of rivastigmine.
| Sl. No. | Degradation condition | % Drug undegraded | % Drug degraded | Retention time | Peak area |
|---|---|---|---|---|---|
| 1 | Acid | 99.3 | 0.6 | 1.456 | 1763.26 |
| 2 | Alkali | 98.7 | 1.2 | 1.456 | 1744.33 |
| 3 | Oxidation (peroxide) | 94.1 | 5.8 | 1.453 | 11369.99 |
| 4 | Photo stability | 98.9 | 1.0 | 1.457 | 8398.80 |
| 5 | Thermal | 99.4 | 0.5 | 1.456 | 1744.35 |
| Parameters | Values | |
|---|---|---|
| Linearity (µg/mL) | 50-150 (µg/mL) | |
| Regression coefficient | 0.9996 | |
| Slope (m) | 107.24x | |
| Intercept (c) | 3163.6 | |
| Regression equation (y= mx +c) | y = 107.24x+3163.6 | |
| Specificity | Specific | |
| System precision (% RSD) | 0.2 | |
| Method precision (% RSD) | 0.8 | |
| Intermediate precision (% RSD) | 0.5 | |
| Ruggedness | 0.42 | |
| LOD | 1.1 µg/mL | |
| LOQ | 3.4 µg/mL | |
| Robustness | Low column oven temperature (35°C) | 0.2 |
| High column oven temperature (45°C) | 0.9 | |
| Lower wavelength (249 nm) | 0.8 | |
| Higher wavelength (269 nm) | 0.7 | |
DISCUSSION
A system suitability test is necessary as a component of the method development, used to ensure that the suitability for rivastigmine analysis. Prior to analyzing samples on each day, a proper procedure has been developed to evaluate the potential of UPLC instrument to conduct techniques that yield results of acceptable accuracy and precision.14 The system suitability system results revealed that the theoretical plates were >2000 and the tailing factor was < 2.
Specificity was evaluated by using a blank and placebo solution. At the retention time of the standard rivastigmine sample, no interference observed in the placebo or blank samples.14 The chromatogram data for system and method precision found to be within the specified limit (% RSD NMT 2.0%). As a result, it was shown that the method was found to be precise.
The chromatogram data for intermediate precision found to be within the specified limit (% RSD NMT 2.0%). As a result, the procedure was determined to be precise.15 The ruggedness chromatogram data was found to be within the specified limit (% RSD NMT 2.0%). As a result, it shown that the method was determined to be rugged.
Dissimilar drug standard solutions were made to evaluate the linearity by diluting the drug stock solutions with diluents in different concentrations of rivastigmine ranging from 12.5 to 75 µg/mL. By using linear regression analysis, the calibration curve of linearity plot was evaluated.15 By the standard addition method, three levels of accuracy samples (50%, 100%, and 150%) were created. The percentage recovery was ranged from 98% to 102%. The recovery results demonstrated that it can be used for quality control of capsule dosage forms. The technique was established to be accurate.16 The lowest limits for detection and quantification were established by means of the subsequent equations based on the slope of calibration and its standard deviation responses using different concentrations of the standard stock solution.
- Limit of detection= 3.3 × SD of the response/ slope of the calibration curve.
- Limit of quantification=10 × SD of the response/ slope of the calibration curve.16
The signal-to-noise (s/n) ratio is taken into consideration to calculate limit of detection and quantification, with limit of detection defined as approximately s/n ~3 and limit of quantification defined as the lowest validated concentrations with (%) RSD and (%) error ≤ 20% and the results were found to be within the specified limits.16 The estimation of robustness by various chromatographic conditions, that include temperature and wavelength changes. Samples were injected into UPLC system and the % RSD was determined and the results were found to be within the limits.
Degradation studies revealed that the significant degradation was scrutinized in alkali and oxidation stress circumstances. Hence it can be concluded that rivastigmine was sensitive to alkali and oxidation.17
CONCLUSION
This newly created technique for measurement of rivastigmine was shown to be easy to understand, reliable, precise, and high resolution. This method will be successfully used for routine analysis at research institutions, quality control departments in intended industries, and approved testing laboratories studies because of the method’s shorter retention time, which also made it more acceptable and cost-effective.
References
- Abhilash KD, George TG. Rivastigmine for Alzheimer’s disease. Expert Rev Neurother. 2014;5(5):563-80. [Google Scholar]
- Shah BM, Misra M, Shishoo CJ, Padh H.. Nose to brain microemulsion-based drug delivery system of rivastigmine: formulation and characterization. Drug Deliv.. 2015;22(7):918-30. [PubMed] | [CrossRef] | [Google Scholar]
- Salatin S, Barar J, Barzegar-Jalali M, Adibkia K, Kiafar F, Jelvehgari M., et al. Development of a nanoprecipitation method for the entrapment of a very water-soluble drug into Eudragit RL nanoparticles. Res Pharm Sci. 2017;12(1):1-14. [PubMed] | [CrossRef] | [Google Scholar]
- Alexandar S, Rohini D, Ashok T. A validated RP-HPLC method for estimation of rivastigmine in pharmaceutical formulations. Pharm Lett. 2011;3(3):421-6. [PubMed] | [CrossRef] | [Google Scholar]
- Avijit C, Vasanta KP, Suddha D. RP-HPLC method for the estimation of rivastigmine in bulk and in dosage forms. J Pharm Res. 2011;4(4):1007-9. [PubMed] | [CrossRef] | [Google Scholar]
- Fathima MZ, Sundhararajan R, Roosewelt C. A validated method for estimation of rivastigmine pure and its pharmaceutical formulations by UV Spectroscopy. Int J Sci Health Res.. 2022;7(2):372-8. [PubMed] | [CrossRef] | [Google Scholar]
- Kulkarni AS, Chandrashekhar VB, Amol NJ. Development of UV spectrophotometric method for estimation of rivastigmine in pharmaceutical dosage form. Int J Pharm Res Scholars. 2018;6(4):59-64. [PubMed] | [CrossRef] | [Google Scholar]
- Bhavyasri K. Development and validation of UV-visible spectrophotometer method for estimation of rivastigmine in human plasma. Int J Adv Res.. 2019;7(5):954-9. [CrossRef] | [Google Scholar]
- Jignesh B, Subbaiah G, Sandeep K. A rapid and sensitive Liquid Chromatography– tandem Mass Spectrometry (LC–MS/MS) method for the estimation of rivastigmine in human plasma. J Chromatogr B. 2007;852(1-2):115-21. [CrossRef] | [Google Scholar]
- Pommier F, Frigola R. Quantitative determination of rivastigmine and its major metabolite in human plasma by liquid chromatography with atmospheric pressure chemical ionization tandem mass spectrometry. J Chromatogr B Analyt Technol Biomed Life Sci.. 2003;784(2):301-13. [PubMed] | [CrossRef] | [Google Scholar]
- Thomas S, Shandilya S, Bharati A, Paul SK, Agarwal A, Mathela CS, et al. Identification, characterization, and quantification of new impurities by LC–ESI/MS/MS and LC–UV methods in rivastigmine tartrate active pharmaceutical ingredient. J Pharm Biomed Anal.. 2012;57:39-51. [PubMed] | [CrossRef] | [Google Scholar]
- 1.4.1 buffer solutions. Indian Pharmacopeia Pp no.. 2014:757-8. [PubMed] | [CrossRef] | [Google Scholar]
- Muriel N, Nicolas A, Maria D. Simultaneous Determination of antidementia drugs in human plasma: procedure transfer from HPLC–MS to UPLC–MS/MS. J Pharm Biomed Anal. 2012;64(4):6-25. [PubMed] | [CrossRef] | [Google Scholar]
- Deshpande GR, Roy AK, Rao NS, Rao BM, Rudraprasad Reddy J. Rapid screening of volatile ion-pair reagents using UHPLC and robust analytical method development using DoE for an acetyl cholinesterase inhibitor: galantamine hbr. Chromatographia.. 2011;73(7-8):639-48. [CrossRef] | [Google Scholar]
- Raju TS, Kalyanaraman L, Reddy VV, Swamy PY. Development and validation of an UPLC method for the rapid separation of positional isomers and potential impurities of rivastigmine hydrogen tartrate in drug substance and drug product. J Liq Chromatogr Relat Technol.. 2012;35(7):896-911. [CrossRef] | [Google Scholar]
- Noetzli M, Ansermot N, Dobrinas M, Eap CB. Simultaneous determination of antidementia drugs in human plasma: procedure transfer from HPLC–MS to UPLC– MS/MS. J Pharm Biomed Anal.. 2012(64-65):16-25. [PubMed] | [CrossRef] | [Google Scholar]
- . Validation of analytical procedures. 1996:1-3. [PubMed] | [CrossRef] | [Google Scholar]
