ABSTRACT
Background
Cramer’s rule is one of the significant techniques applied to settle an arrangement of conditions. In this rule, the upsides of the factors in the framework are to be determined utilizing the determinants of networks. Consequently, Cramer’s rule is otherwise called the determinant rule. Few analytical methods for simultaneous estimation of Lamivudine, Tenofovir disoproxil fumarate and Efavirenz available currently are UPLC, RP-HPLC which are quit affordable. UV-Visible method is also available but that are not based on Cramer’s rule which affords more accurate results in analytical research protocols. Traditional method needs to separate the LAM, TDF and EVZ before analysis. Proposed method did not need to separate these 3 drugs and only needs to prepare the sample solution directly as per given in the assay procedure and measure the absorbance at 262 nm, 247nm and 272 nm.
Materials and Methods
Jasco V- 730 double beam UV- vis-spectrophotometer at wavelength range of 200-400 nm was used for research protocol. Trioday tablet containing three Anti-HIV drugs and manufactured by Cipla were used for the study. Methanol and freshly prepared distilled water was used as solvents. UV-visible spectroscopy method is applied for simultaneous estimation of Lamivudine, Tenofovir disoproxil fumarate and Efavirenz in their ternary mixture and their tablet dosage form. UV-vis-spectrophotometry is based on the additivity of absorbance of drugs. The drugs show maximum absorbance at 247 nm for Efavirenz, 262 nm for Tenofovir and 272 for Lamivudine in methanol so these wavelengths were selected for further analysis. Matrix was drawn using the standard absorptivity values obtained at all the three wavelengths and the amount of drug in the tablet dosage form was calculated by solving matrix using Cramer’s rule. The developed method was validated as per ICH guidelines.
Results
The maximum wavelength found to be linear in the range of 5-30 μg/mL for Lamivudine and Tenofovir disoproxil fumarate while 10-60 μg/mL for Efavirenz. The precision was carried out at two level viz intra-day and inter-day for which the RSD was found within limit (<%2). Recovery study was carried out on the developed method and the recovery was found to be in the range of 97.5 – 102.5%.
Conclusion
From analytical data it can be concluded that all the three drugs obey the Beers-Lambert’s law at these selected wavelengths of maximum. Method was found to be simple, sensitive, precise and accurate. The developed method can be applied for the routine analysis of the Lamivudine, Tenofovir disoproxil fumarate and Efavirenz in combined dosage form using Cramer’s rule.
INTRODUCTION
Tablet containing Lamivudine (LAM), Efavirenz (EFZ), Tenofovir Disoproxil Fumarate (TDF), is prescribed combination used to stop or slow down the progression of HIV infection; also used to treat chronic hepatitis B virus infection in adults. This combination shows promising results as it helps to increase the lifespan of patient by restricting the HIV growth in the body. Basically, it is an antiretroviral medicine which boost up the immunity to fight against the Acquired Immune Deficiency Syndrome (AIDS).
Lamivudine and Tenofovir are designated as synthetic nucleoside reverse transcriptase inhibitor while Efavirenz belong to class non-nucleoside reverse transcriptase inhibitor. Lamivudine is soluble in methanol and in water. Efavirenz is soluble in methanol, insoluble in water while Tenofovir disoproxil fumarate is soluble in methanol and distilled water.1–4
Currently, the literature survey reveals few methods available for the simultaneous estimation of LAM, EFZ and TDF in a combined dosage form like UPLC,5,6 RP-HPLC7–12 and UV-vis- derivative spectroscopic methods.12,13 The aim of present study is to develop a simple, accurate, effective and rapid method for the simultaneous estimation of LAM, EFZ and TDF in a combined dosage form.
MATERIALS AND METHODS
Instrumentation
Jasco V-730 double beam UV-vis-spectrophotometer with 1 cm matched quartz cells was used for study. The spectra in the presented study were recorded at spectral band width of 1.0 nm with the scanning speed 400 nm/min and data pitch 1nm. Range for scanning wavelength was 200-400 nm.
Trioday tablets manufactured in India by Cipla containing Lamivudine (300 mg) Efavirenz (600mg) and Tenofovir Disoproxil Fumarate The methanolwas obtained from multi-speciality hospital pharmacy. Methanol used was of AR grade (LOBA Chemie, India). Freshly prepared double distilled water was used in the experiment.
Experimental
Preparation of standard stock solution
Stock solution of 100 µg/mL for LAM, TDF and EFZ was prepared by weighing accurately 10 mg of standard drugs and dissolving in 100 mL of methanol to get concentration of 100 µg/mL each.
Determination of wavelength of maximum absorbance
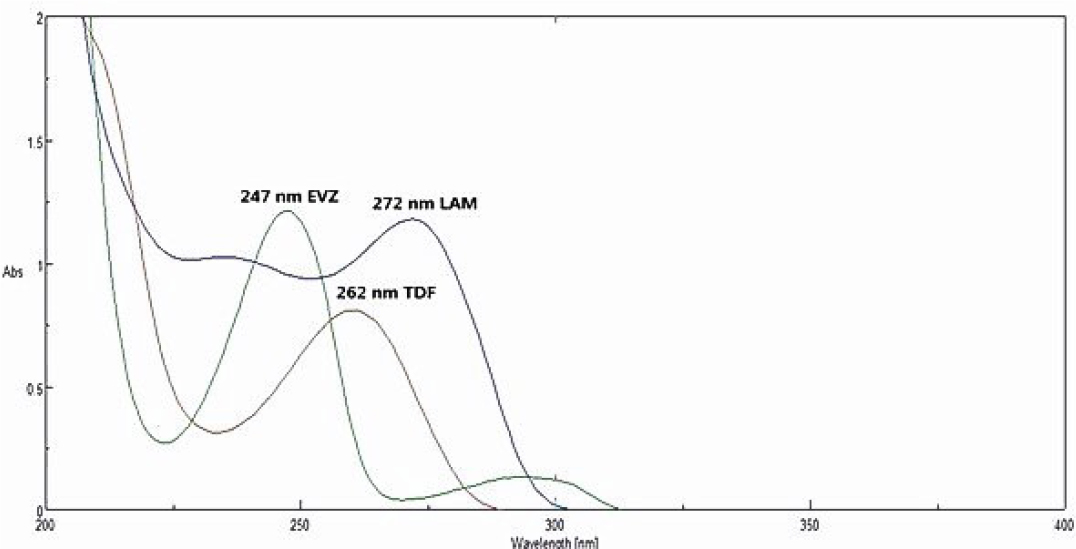
The prepared dilution of LAM, EFZ and TDF having concentration of 30 μg/mL was scanned in the range of 200-400 nm. The wavelength of maximum i.e., lambda max for LAM, EFZ and TDF were found to be at 272, 247, 262 nm respectively. Overlain spectra of EVZ, TDF and LAM in methanol is shown in Figure 1.

Figure 1:
Overlain spectra of EVZ, TDF and LAM in methanol.
Preparation of calibration curve
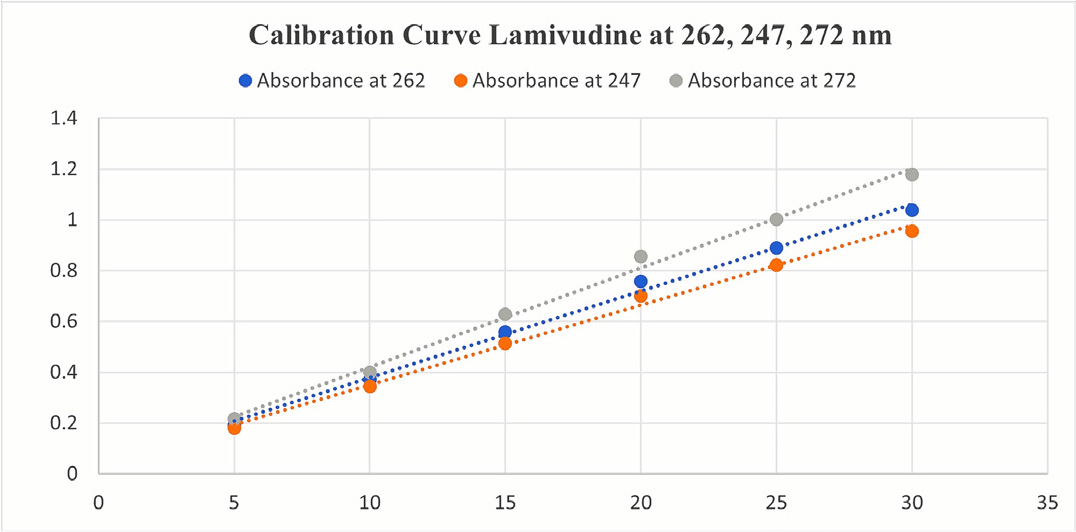
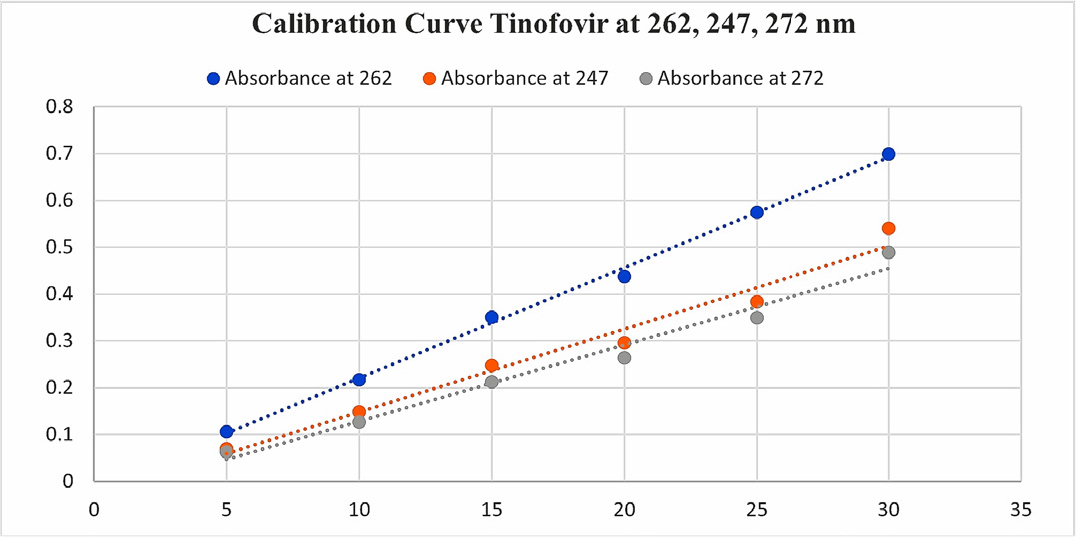
The stock solution of LAM and TDF was diluted appropriately with methanol and six dilutions were prepared in concentration range of 5-30 μg/mL and the dilutions for both drugs were measured for absorbance at 272, 247, 262 nm (Figures 2 and 3).

Figure 2:
Calibration curve of LAM at 262, 247, 272 nm.

Figure 3:
Calibration Curve TDF at 262, 247, 272 nm.
The stock solution of EFZ was diluted appropriately with methanol and dilutions was prepared in concentration range of 10-60 μg/mL and the absorbance of these six dilutions was measured at 272, 247, 262 nm (Figure 4).

Figure 4:
Calibration Curve EFZ at 262, 247, 272 nm.
RESULTS
Assay of marketed formulation
Marketed tablets of LAM, TDF and EVZ, Trioday (300 mg, 300 mg, 600 mg) were weighed accurately and finely powdered. Tablet powder equivalent to 10 mg of TDF (10 mg of and LAM; 20 mg of EVZ) was taken and transferred to 10 mL volumetric flask and was diluted with 5 mL of methanol. The prepared solution was sonicated for 10 min, and after sonication volume made up to 10 mL. Whatman filter paper no. 41 was used to filter the sonicated solution. 5 mL of filtrate was taken in 50 mL of volumetric flask and diluted to 50 mL with methanol. The procedure was repeated 6 times for tablet formulation. Absorbance was measured at three selected wavelengths and concentrations were determinedby solving matrix by using a Cramer’s rule. The assay results are presented in Table 1.
| Assay Result | ||||||||
|---|---|---|---|---|---|---|---|---|
| LAM | EVZ | TDF | LAM | EVZ | TDF | LAM | TDF | EVZ |
| Actual conc. (mcg/mL) | Obtained conc. (mcg/mL) | % Recovery | ||||||
| 10 | 20 | 10 | 9.93 | 9.98 | 19.78 | 99.32 | 99.87 | 98.90 |
| 10 | 20 | 10 | 9.90 | 10.14 | 20.00 | 99.09 | 101.40 | 100.01 |
| 10 | 20 | 10 | 9.75 | 9.77 | 19.73 | 97.57 | 97.78 | 98.68 |
| 10 | 20 | 10 | 9.72 | 9.89 | 19.52 | 97.20 | 98.94 | 97.63 |
| 10 | 20 | 10 | 10.17 | 10.14 | 19.61 | 101.76 | 101.49 | 98.08 |
| 10 | 20 | 10 | 9.60 | 9.98 | 19.71 | 96.09 | 99.84 | 98.55 |
| Mean | 98.50 | 99.88 | 98.64 | |||||
| SD | 1.997 | 1.426 | 0.812 | |||||
| % RSD | 2.02 | 1.42 | 0.823 | |||||
Method validation14
Precision
The intraday and inter-day precision of the method was carried expressed as relative standard deviation. Intraday precision was determined at three concentration level in triplicate for all three drugs (n = 9). For LAM and TDF at 10, 15, 20 µg/mL and for EVZ at 10, 20, 30µg/mL. Inter-day precision was determined by analysing each drug on the next consecutive day with the same concentration as mentioned above.
Accuracy
The accuracy study was carried out by standard addition method. The standard solution was spiked into the sample solution at three levels 50%, 100% and 150% of assay concentration. The sample concentration used were 10 μg/mL for LAM and TDF and 20 μg/mL for EVZ. The prepared samples were scanned in the range of 200-400 nm. The amount of drugs was calculated by solving the Cramer’s matrix. Accuracy data is presented in Tables 2, 3 and 4.
| Level % | Sample Conc. μg/mL | Amount Added μg/mL | Total Conc μg/mL | % Recovery | % RSD |
|---|---|---|---|---|---|
| 50% | 10 | 5 | 15 | 100.59 | 1.168 |
| 99.92 | |||||
| 98.32 | |||||
| 100% | 10 | 10 | 20 | 98.09 | 1.820 |
| 99.87 | |||||
| 101.72 | |||||
| 150% | 10 | 15 | 25 | 98.17 | 1.553 |
| 98.03 | |||||
| 98.03 |
| Level % | Sample Conc. μg/mL | Amount Added μg/mL | Total Conc μg/mL | % Recovery | % RSD |
|---|---|---|---|---|---|
| 50% | 10 | 5 | 15 | 101.88 | 1.326 |
| 99.58 | |||||
| 99.57 | |||||
| 100% | 10 | 10 | 20 | 97.63 | 1.466 |
| 97.98 | |||||
| 100.29 | |||||
| 150% | 10 | 15 | 25 | 100.14 | 1.087 |
| 99.79 | |||||
| 98.12 |
| Level % | Sample Conc. μg/mL | Amount Added μg/mL | Total Conc μg/mL | % Recovery | % RSD |
|---|---|---|---|---|---|
| 50% | 10 | 5 | 15 | 100.17 | 0.317 |
| 99.01 | |||||
| 99.74 | |||||
| 100% | 10 | 10 | 20 | 101.28 | 0.663 |
| 99.99 | |||||
| 99.99 | |||||
| 150% | 10 | 15 | 25 | 100.01 | 0.566 |
| 99.00 | |||||
| 99.00 |
DISCUSSION
To begin with, the overlain spectra of LAM, TDF and EVZ were studied in the different solvents. As a result, the methanol was found to be more suitable solvent for the analysis of these drugs in the UV spectrophotometry as it offered the advantages of ease of solubility over the other solvents. All the three drugs LAM, TDF and EVZ shows absorbance at the wavelength of maximum of each other. So, the absorbance of the mixture at one of the drug’s wavelength of maximum is the sum of absorbance all three drug. By applying the Beer- lambert’s equation (A= abc, where a = absorptivity, b = path length (1 cm), c= concentration)The absorbance of the mixture at the three wavelength represents as following:
Here, Am1, Am2, Am3 are the absorbances of the mixture at 262 nm (λ1), 247 nm (λ2), 272 nm (λ3), respectively where cx, cy and cy are the concentration of LAM, TDF and EVZ. In the above equation, ax1, ax2, and ax3 are the absorptivity’s of LAM; ay1, ay2, and ay3 are the absorptivity’s of TDF and az1, az2, and az3 are the absorptivity’s of EVZ at the three wavelength of maximum 262 nm, 247 nm, 272 nm; respectively.
The above matrix was further solved by calculating the absorptivity’s from the calibration curve and the equation was derived as follows.
So, in the above equation there are three unknown concentrations, to easily solve the above matrix Cramer’s rule method was applied. The result was the concentrations of the LAM, TDF, and EVZ in the mixture.
It was observed that the all drugs obey the Beer-Lambert’s law in the different concentration range. Precision was carried at intraday and inter-day level and result found that the method was precise, as RSD for proposed method was satisfactory (< 2%) as shown in Table 5.
Recovery study was also carried out on the developed method and result found to be in the range of 97.5-102.5%. The assay was performed on the marketed tablet Trioday with the label claim 300 mg LAM, 300 mg TDF and 600 mg EVZ. The amount of drug found within pharmacopeial limits. Assay was performed (n = 6) and results are given in Table 1.
| Parameters | Lamivudine | Tenofovir disoproxil fumarate | Efavirenz | |
|---|---|---|---|---|
| Wavelength maximum | 272 nm | 262 nm | 247 nm | |
| Linearity Range (μg/mL) | 5-30 μg/mL | 5-30 μg/mL | 10-60 μg/mL | |
| Correlation Coefficient(R2) | 0.995 | 0.997 | 0.997 | |
| Slope | 0.998 | 0.996 | 0.985 | |
| LOD (μg/mL) | 1.21 | 0.56 | 0.41 | |
| LOQ (μg/mL) | 3.67 | 1.70 | 1.26 | |
| % Recovery | 98.50 | 99.88 | 98.64 | |
| Assay (%RSD) | 2.027 | 1.428 | 0.82 | |
| Accuracy(%RSD) | 50% | 1.168 | 1.326 | 0.317 |
| 100% | 1.820 | 1.466 | 0.663 | |
| 150% | 1.553 | 1.087 | 0.566 | |
| Precision (%RSD) | Intra-day | 1.315 | 0.515 | 0.975 |
| Inter-day | 1.315 | 1.796 | 0.540 |
Traditional method needs to separate the LAM, TDF and EVZ before analysis. Proposed method needs to prepare the sample solution as per given in the assay procedure and measure the absorbance at 262 nm, 247 nm and 272 nm. Matrix was drawn using the absorbances obtained at the entire three wavelengths and then the matrix was solved using Cramer’s rule. The final answer was the amount of each drug in the sample solution. The results for the validation parameters are given in Table 5.
CONCLUSION
The proposed UV-vis spectrophotometric method based on Cramer’s rule was found to be less time consuming and easy, as it involves very limited steps for analysis. Method was found to be simple, sensitive, precise and accurate. The developed method can be applied for the routine analysis of the LAM, TDF and EVZ.
References
- Madeesh SK, Ismail Y, Gunasekaran V.. Development and validation for simultaneous estimation of lamivudine, tenofovir and efavirenz by UPLC. Int J Pharm. 2012;2(3):656-60. [Google Scholar]
- Chengalva P, Kuchana M. Development and validation of ultra-performance liquid chromatographic method for the simultaneous estimation of lamivudine, tenofovir disoproxil fumarate, doravirine and efavirenz in bulk and pharmaceutical formulations. Indian J Pharm Sci.. 2020;82(6):1006-14. [Google Scholar]
- Vanaja P. N Anusha, Prasad Giri V.. S: development and validation of a RP-HPLC method for simultaneous estimation of lamivudine, tenofovir disoproxil fumarate and efavirenz in a combined tablet dosage form. Int J Pharm Pharm Sci. 2013;5(3):116-21. [Google Scholar]
- Venkataramana Rao. S. N., Srinivas P., Meghana R., Anitha. P.. Method Development and Validation for Simultaneous Estimation of Lamivudine, Tenofovir Disoproxil Fumarate and Efavirenz in Combined Tablet Dosage Form by RP-HPLC. World J Pharm Pharm Sci.. 2014;3(10):1658-71. [Google Scholar]
- Sumanth KS, Rao AS, Shankar. G.D.. New gradient RP-HPLC method development and validation for simultaneous estimation of Lamivudine. Tenofovir disoproxil fumarate and efavirenz in pharmaceutical dosage forms. Int J Pharm Chem Biol Sci.. 2018;8(2):195-203. [Google Scholar]
- Anandakumar K, Abirami G, Murugan S, Ashok B.. RP-HPLC method for simultaneous estimation of lamivudine, tenofovir disoproxil fumarate and efavirenz in tablet formulation. J Anal Chem. 2013;68(9):815-21. [CrossRef] | [Google Scholar]
- Srinath AB, Sneha AA, Ahmed R, Kulkarni RG. Method development and validation for simultaneous estimation of lamivudine, tenofovir and efavirenz in combined tablet dosage form by RP-HPLC and UV-spectroscopic method. Int J Pharm Sci Res.. 2014;5(12):5491-7. [CrossRef] | [Google Scholar]
- Padmavathi Y, Alvala R, Garige JS, Babu RN, Elluri S. Simultaneous estimation of tenofovir disoproxil fumarate, efavirenz and lamivudine in fixed dose combination tablets by ultraviolet spectrophotometry in multicomponent mode and its application in rat plasma. Asian J Pharm Health Sci.. 2020;10(2):2248-54. [CrossRef] | [Google Scholar]
- Sharma R, Mehta K. Simultaneous spectrophotometric estimation of tenofovir disoproxil fumarate and lamivudine in three component tablet formulation containing efavirenz. Indian J Pharm Sci.. 2010;72(4):527-30. [PubMed] | [CrossRef] | [Google Scholar]
- ICH guidelines for validation of analytical procedures: text and methodology. Vol. Q2 (R1). 2005:1-17. [PubMed] | [CrossRef] | [Google Scholar]
