ABSTRACT
Introduction
Favipiravir was remerging antiviral drug in the beginning era of COVID-19 Pandemic as an urgent therapeutic alternative to treat COVID-19. Literature survey reveals that there is no any reported stability indicating HPTLC method for this non-pharmacopoeial drug. So current scheme of research work focuses on development and Validation of SI-HPTLC method for quantification of FVP in bulk and commercial film coated tablet.
Materials and Methods
Silica Gel 60 F254 plates used as stationary phase to carried out chromatographic separation using mobile phase Toluene: Methanol: Ethyl Acetate: Formic acid (7: 1: 2: 0.5). Densitometric scanning of well resolved bands of FVP was carried out at 325 nm. The propose SI-HPTLC method was validated as per ICH Q (R1) guidelines.
Results
It was found to be Sensitive, Selective, Accurate and Precise in nature and can be applied for routine In-Process Quality Control testing of Commercial Film Coated Tablet of FVP. FVP was subjected to various stress condition in force degradation study and was found to be more susceptible for alkaline degradation. Alkaline degradants further subjected to LCMS analysis in order to reveal possible degradation pathway of FVP in alkaline condition.
Conclusion
Developed HPTLC method is sensitive, accurate, selective and precise in nature and can be applied for quantification for Favipiravir in bulk and commercial film coated tablet.
INTRODUCTION
Health emergency – SARS-CoV-2 (also known as COVID-19) has spread rapidly worldwide in the last year. International health agencies embraced the repurposing strategy to combat COVID-19 quickly. Besides Immunotherapeutic agent few small molecules have proven to be useful and Favipiravir is one of them.1,2
FVP is prodrug biotransformation by phosphorylation into its active form favipiravir-ribofuranosyl triphosphate (T-705-RTP) which inhibit viral transcription and replication by inhibiting RNA dependent RNA polymerase (RdRp).3–5 As an influenza treatment, favipiravir’s catalytic domain as a primary target of favipiravir is likely to work similarly against other RNA viruses such as SARS-CoV-23 So in light of this, it is a potential candidate drug for COVID-19 is worth further exploration. As per literature survey that there has not yet been a study and report published on Stability indicating HPTLC method for quantification of favipiravir in bulk and commercial film coated tablet. Therefore, our current scheme research work is aimed at developing and validating a Stability Indicating HPTLC method for quantification of Favipiravir in bulk and commercial film coated tablets in accordance to ICH Quality guidelines. During method development implementation of force degradation approach was utilized to challenge the developed analytical method to screen all possible degradants product and also to test intrinsic stability of drug. In addition to this all the degradants product was aspirated out by Reverse Phase HPLC prior to mass spectroscopic analyses by Orbitrap high-resolution mass spectroscopic method.
Different analytical method has been reported till date such as HPLC and UV-visible Spectrophotometric analysis for individual quantification of favipiravir in the biological fluids, bulk and in FPP. Amongst several reported analytical method few of them found to be worth mentioning. An isocratic RP-HPLC method have been reported for quantification of FVP.6 UV-visible Spectroscopic method also been reported for quantification of FVP using ethanol and water as solvent system in bulk and in FPP.7 In addition to that Triple-Quadrupole mass spectroscopic method was also been published to access bioequivalence property of FVP tablet formulation Favipiravir 200 mg produced by Eva pharma in accordance with Avigan® 200 mg tablet as a reference product manufactured by Toyama Pharmaceutical Co., Ltd., Japan.8 Plain 1H NMR profiling also been reported to differentiate between Favipiravir from its structurally similar analogues Pyrazinamide and Nicotinamide (Vitamin B3) which also consist of six membered aromatic N-heterocyclic rings. Plain 1H NMR provide detail insight for the detection and drug falsification.9
MATERIALS AND METHODS
Chemical and Reagents
Drug sample of an antiviral agent Favipiravir was procured as a gift sample from Macleods Pharmaceutical Ltd., Andheri East, Mumbai (India) along with its certificate of analysis. All the solvents and chemicals used to carry out research work were AR grade. Methanol (99.8%, Loba Chemie), Ethyl Acetate (99.68%, Loba Chemie), Toluene (99.71%, Research – Lab Fine Chem Industries), Formic Acid (98%, Sisco Research Laboratories Pvt. Ltd.,). HPTLC Pre-coated silica gel 60 F254 Aluminium backed plates were procured from E. Merck Chemical, Mumbai (India). Commercial film coated tablet (FaviHope™ 400) containing 400 mg of favipiravir was purchased from local pharmacy.
HPLC method development
Instrumentation and Chromatographic conditions
CAMAG® Linomat-V HPTLC applicator (CAMAG, Muttenz, Switzerland) equipped with Hamilton® 100 µL syringe (Hamilton, Bonaduz, Switzerland) used for application of sample in the form of bands on 10×10 HPTLC Pre-coated silica gel 60 F254 Aluminium backed plates (E. Merck Chemical, Mumbai, India) by using spray-on application technique with constant spraying rate of 3ul/s with the help of nitrogen gas. CAMAG® TLC scanner-III (CAMAG, Muttenz, Switzerland) it was used for generation and analysis of densitogram. CAMAG® 10×10 twin trough glass chamber with a stainless-steel lid (CAMAG, Muttenz, Switzerland) was used for development of HPTLC plate for saturation time of 10 min. Instrument handling and data acquisition was processed by WinCATS software, Version 1.4.4.633 (CAMAG, Muttenz, Switzerland). An application positioning parameter such as application position (Y) 8.0 mm, first track position (X) 15 mm, band width 6mm and track distance 14 mm were predefined and kept constant throughout the course of application.
Densitometric Parameters
Deuterium lamp was used as source of radiation emitting continuous UV radiation in range of 190 to 400 nm. Absorbance/reflectance mode are used for densitometric scanning at selected wavelength of 325 nm. Following criteria were taken into account for densitometric generation: data resolution – 100 µm/step; scanning speed – 20 mm/s; Slit dimension – 5.00 x 0.45.
Mobile phase optimization
Polarity and functional groups present in drug molecule are taken into consideration for development and optimization of mobile phase. Various trials were executed for development of mobile phase to get reproducible sharp peaks. Linear ascending mode was selected for chromatographic development. Glass Twin through chamber was saturated for 10 min before development of HPTLC Plates.
Preparation of Standard solution
Favipiravir was found to be completely soluble in AR Grade methanol so whole sample preparation procedure was carried out in methanol. 40 mg of pure drug Favipiravir was weighed accurately on analytical weighing balance (SHIMADZU AUX 220) and transferred into 10 mL volumetric flask and dissolved into sufficient amount of methanol then further volume was adjusted by methanol up to 10 mL. Resulting the solution of 4000 µg/mL.
Preparation of Test solution
Ten commercially available film coated tablets of FaviHope™ 400 (Batch No – HFV21015A) containing 400 mg of favipiravir per tablet was weighed accurately on analytical weighing balance (Model – SHIMADZU AUX 220) and ground into fine powder in mortar. Quantity equivalent to 40 mg of favipiravir was transferred in 10 mL volumetric flask and dissolved into sufficient amount of methanol. Resulted solution was filtered out to remove any residual particulate matter of excipient and volume was adjusted to 10 mL by adding methanol. Resulting test solution of 4000 µg/mL further used for estimation of FVP using developed method.
Method Validation
As most of well-known regulatory bodies of countries like USA, Japan, European Union follows ICH guidelines as a part of registration application so analytical method validation procedures in this research work was carried out as per protocols mentioned in ICH Q2(R1) to validate developed method. ICH Q2(R1) summarize what criteria analyst should consider during the course of method validation. Quantitation of FVP were validated for Linearity, accuracy, precision, robustness, sensitivity, specificity.10
Establishment of calibration curve
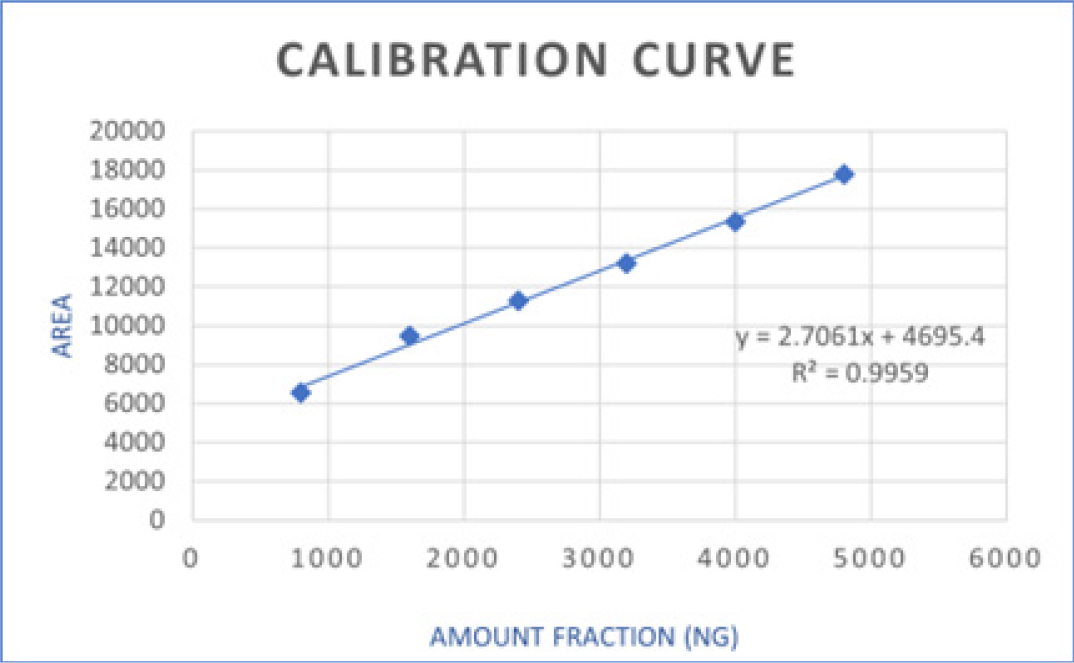
Linearity of the method assessed by constructing calibration curve. Different volume of standard stock solution of FVP applied in such way that it gives set of six concentrations ranging from 800–4800 ng/band. In order to construct the calibration curve of FVP, three replicates were performed at each concentration (n=3) In addition, the average of the triplicate measurements for each concentration was used to construct a calibration curve.
Accuracy Studies
To ascertain the accuracy of proposed method, % recovery studies were carried out by standard addition method. In which spiking of the standard drug solution in predetermined test solutions at concentration level of 50%, 100%, 150%. % Recovery evaluated at different % spiked level of sample solution in standard solution i.e., 50%, 100% and 150%
Method Precision
Precision of developed analytical method was determined in the term of interday and intraday precision. Both intraday and interday precision was determined by quantitation of freshly prepared standard FVP solution at LQC, MQC and HQC i.e., 800, 3200, 4800 ng/band. Precision of favipiravir was carried out in three replicates for each QC sample (n=3) Intraday precision was determined on same day while interday precision was determine on three constructive days. The results of both Intraday and Interday precision were evaluated in terms of % relative standard deviation.
Sensitivity
The level of sensitivity of the developed analytical method access in terms of limits of detection and limits of quantification which was calculated as per the equation mentioned in International Conference on Harmonization guidelines Q2 (R1).10 Where σ represents standard deviation of intercept and S is slope of the calibration curve.
Selectivity
Selectivity is ability of developed analytical method to response towards analyte of interest in presence of blank and matrix. Selectivity of developed analytical method monitored by densitometric scanning of blank, formulation and Standard. Densitometric scanning of bands of blank, formulation and standard solution shows no any interreferences with drug Rf value which reveals that developed analytical method is selective in nature by generating response without getting affected by interference from matrix and blank.
Robustness
A robust analytical method is one that is able to remain unchanged despite small deliberate changes in its parameters during normal day-to-day usage, which indicates reliability of the developed analytical method. Robust nature of developed analytical method is accessed by inducing small deliberate variations in mobile phase composition, mobile phase volume and saturation time used for plate development and standard solution at MQC 3200 ng/band is quantified using proposed HPTLC method and robustness was evaluated in terms of % recovery.
Assay
Developed HPTLC method was applied to perform assay of the commercially available film coated tablet FaviHope™ 400 (Batch No – HFV21015A) by Macleods Pharmaceutical Ltd. A test solution of 0.8µL containing equivalent 3200ng of favipiravir was spotted in six replicates on a plate (n=6) in the form of bands and analyzed for evaluation of assay. FVP content in commercial film coated tabled were obtained from the calibration curve of FVP. Results obtain from assay evaluation of formulation are express in terms of % recovery and %RSD.
Forced degradation studies
By utilizing degradation products generated during the force degradation process, we can gain insight into the stability indicating nature of the developed analytical method, which later can be used for evaluation of the samples generated from accelerated and long-term stability studies. Force degradation helps to reveals the stability of the drug under various stress conditions. Drug stability data arises from force degradation studies can be used to determine ideal formulation and packaging conditions, as well as to determine shelf life of a drug. In addition to that this information can also be used to determine the optimum storage conditions for the drug molecule. Standard Favipiravir drug was subjected to Acid, Alkali, Peroxide and Neutral degradation.
Sample preparation for force degradation studies
40 mg of FVP pure drug weighed accurately and subjected to 3mL of 0.1 N HCl, 0.1 N NaOH, 3% H2O2 and distilled water and kept at ambient room temperature for 2 hr for acid, alkali, peroxide and neutral degradation respectively, after 2 hr both acid and alkaline solution was neutralized by adding equimolar amount of alkali and acid respectively to stop further degradation reaction of the drug. After 2 hr, volume of the all resulted solution was adjusted with methanol up to 10 mL and applied on TLC plates for chromatographic development and further subjected to densitometric analysis.
Isolation and characterization of major degradants by LCMS analysis
LCMS instrument (Model: UHPLC-MS Q Extractive Hybrid Quadrupole Orbitrap MS) was used for the isolation and characterization of degradants. Methanol (90%): Water (10%): Formic acid (0.1%) was chosen as mobile phase for column chromatographic separation which was carried out prior to the mass spectra generation in order to resolve degradants from its mixture solution.
RESULTS
Mobile phase optimization
After carrying several trials and alteration in ratios of selected mobile phase component, Toluene: Methanol: Ethyl Acetate: Formic acid at ratio of 7: 1: 2: 0.5 respectively was found to be optimal to carried out further chromatographic development.
Linearity and calibration curve
Accuracy study
% Recovery evaluated at different % spiked level of sample solution in standard solution i.e., 50%, 100% and 150% was found to be 100.49%, 99.99% and 99.63% respectively. % Recovery of FVP was carried out in three replicates (n=3) for each % spiked level. The results are presented in Table 1.
| Spiked level % | Amount added (ng/band) | Amount recovered (ng/band) | % Recovery | Average | SD | %RSD |
|---|---|---|---|---|---|---|
| 50 | 2400 | 2430.87 | 101.28 | 100.79 | 0.7267 | 0.7209 |
| 2400 | 2399.09 | 99.96 | ||||
| 2400 | 2427.44 | 101.14 | ||||
| 100 | 3200 | 3174.33 | 99.32 | 99.51 | 0.7662 | 0.7699 |
| 3200 | 3163.85 | 98.87 | ||||
| 3200 | 3211.66 | 100.36 | ||||
| 150 | 4000 | 3950.61 | 98.76 | 98.76 | 0.3301 | 0.3343 |
| 4000 | 3937.29 | 98.43 | ||||
| 4000 | 3963.71 | 99.09 |
Method Precision
The results of both Intraday and Interday precision were evaluated in terms of % relative standard deviation which are presented in Table 2.
| Concentration (ng/band) | Area | Mean Area | SD | RSD | %RSD | |
|---|---|---|---|---|---|---|
| Intraday | 800 | 6579.02 | 6588.04 | 12.823775 | 0.0019465 | 0.1946524 |
| 6602.72 | ||||||
| 6582.38 | ||||||
| 3200 | 13146.46 | 13123.263 | 20.415123 | 0.0015556 | 0.1555644 | |
| 13115.3 | ||||||
| 13108.03 | ||||||
| 4800 | 17777.76 | 17799.4 | 19.094837 | 0.0010728 | 0.107278 | |
| 17813.88 | ||||||
| 17806.56 | ||||||
| Interday | 800 | 6576.53 | 6580.4344 | 3.3813481 | 0.0005138 | 0.0513849 |
| 6582.3867 | ||||||
| 6582.3867 | ||||||
| 3200 | 13166.667 | 13209.503 | 54.926224 | 0.0041581 | 0.4158084 | |
| 13190.417 | ||||||
| 13271.427 | ||||||
| 4800 | 17793.053 | 17793.658 | 26.658473 | 0.0014982 | 0.1498201 | |
| 17820.613 | ||||||
| 17767.307 |
The sensitivity of the developed method was determined through calculation of LOD and LOQ. The LOD was found to be 30.2028ng and LOQ of 115.76 ng.
Selectivity
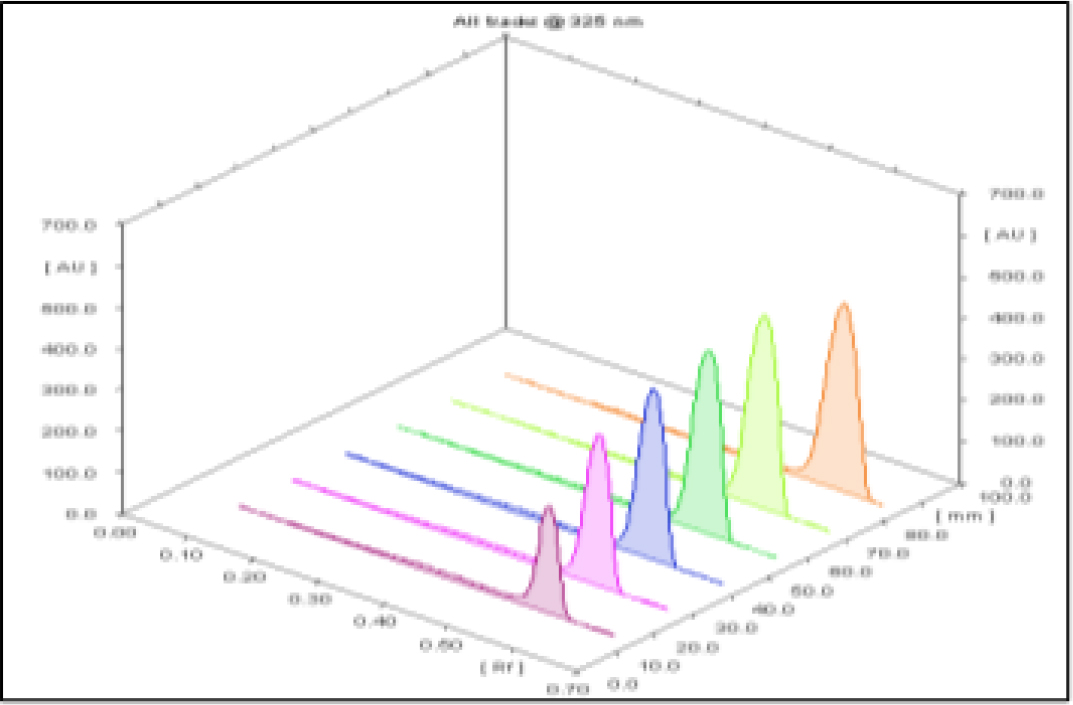
Densitometric scanning of bands of formulation and standard solution shows no any significant interreferences with drug Rf value which reveals that developed analytical method is selective in nature by generating response without getting affected by interference from matrix. As presented in Figure 2.
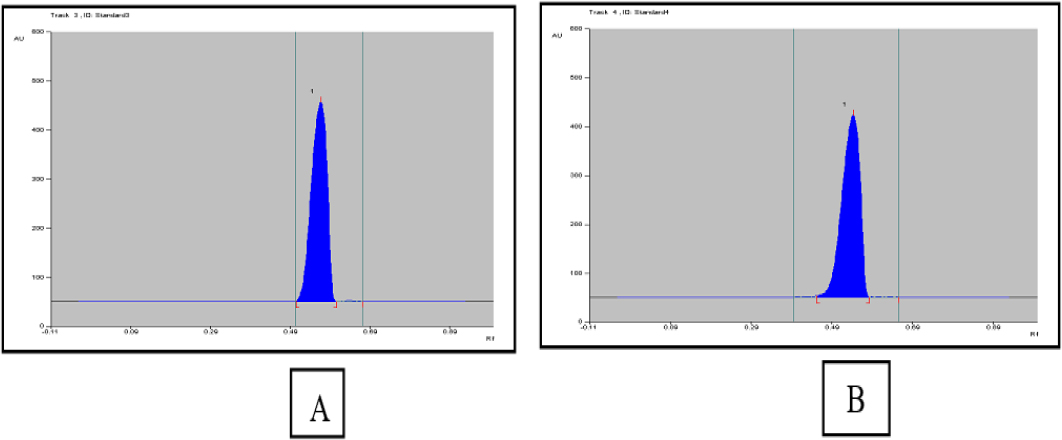
Figure 2:
3D Chromatogram of standard FVP and formulation.
Robustness
The results of robustness study are presented in Table 3.
| Parameter | Variation | % Recovery ± SD |
|---|---|---|
| Mobile phase composition (MeOH: Toluene: EA: FA) | 1:7:1.5:1 | 101.45 ± 0.59 |
| 1:7:2:0.5 | 99.88 ± 1.59 | |
| 1:7.5:2:1 | 102.15 ± 1.30 | |
| Mobile phase volume | 08 mL | 102.62 ± 0.53 |
| 10 mL | 99.88 ± 1.59 | |
| 12 mL | 102.30 ± 0.32 | |
| Saturation time | 08 min | 101.15 ± 0.15 |
| 10 min | 99.88 ± 1.59 | |
| 15 min | ± 2.66 |
Assay
Results obtain from assay evaluation of formulation are expressed in terms of %Recovery and %RSD which are presented in Table 4.
| Theoretical Concentration | Found Concentration | % Recovery | %RSD |
|---|---|---|---|
| 3200 | 3149.643398 | 99.84864442 | 1.0437 |
Forced degradation studies
The results of forced degradation studies are presented in Table 5. and respective chromatograms in Figure 3.
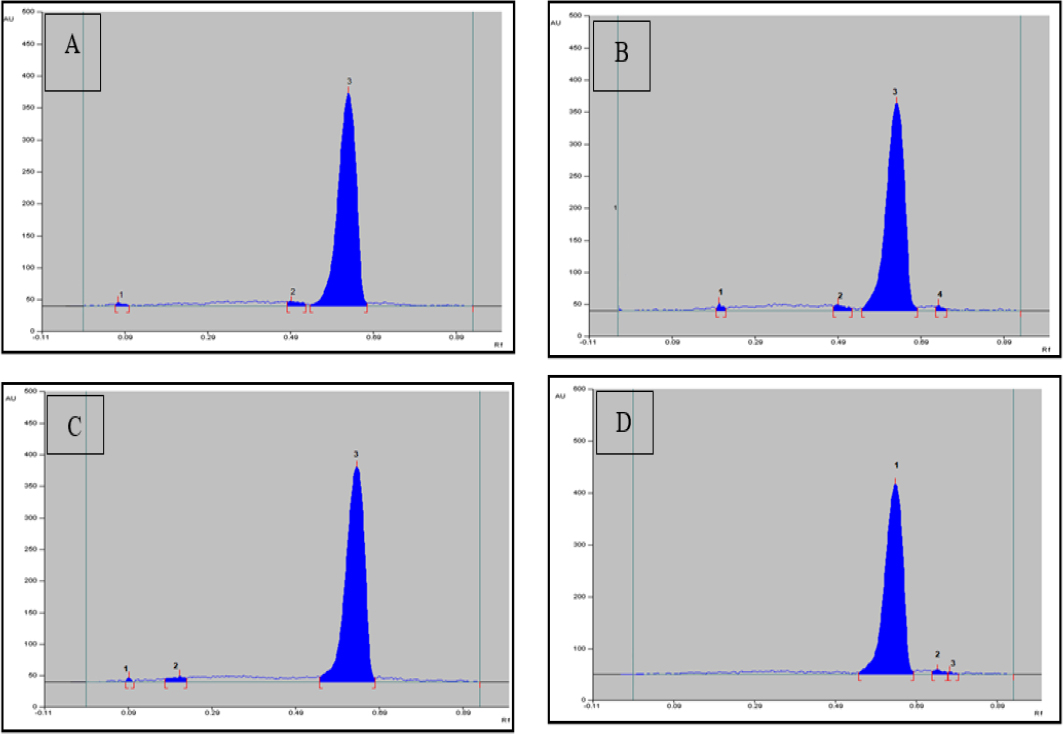
Figure 3:
Chromatogram of FVP after (A) acid induced degradation (B) alkali induce degradation (C) Peroxide degradation (D) Neutral Degradation.
| Stress conditions | Number of degradation products (Rf) | Exposure time | Temperature | % Degredation |
|---|---|---|---|---|
| 0.1 N HCl | 2 (0.07, 0.49) | 2 Hr. | RT | 10.66% |
| 0.1 N NaOH | 3 (0.2, 0.49, 0.73) | 2 Hr. | RT | 11.94% |
| 3% H2O2 | 2 (0.09, 0.21) | 2 Hr. | RT | 6.71% |
| Neutral (Distilled Water) | 2 (0.74, 0.77) | 2 Hr. | RT | 0.041% |
Isolation and Characterization of major degradants by LCMS Analysis
After the resolution of an alkaline degradant mixture through a column (Model: C18, Hypersil Gold, Particle size 3µ, 150mm x 3mm) two chromatographic peaks of degradant products were observed at a retention time of 1.04 min (Figure 4a) and 1.55 min (Figure 4b). Possible degradation pathway from masses of two degradant peaks is given in Figure 5. The summary of all validation parameters are presented in Table 6.
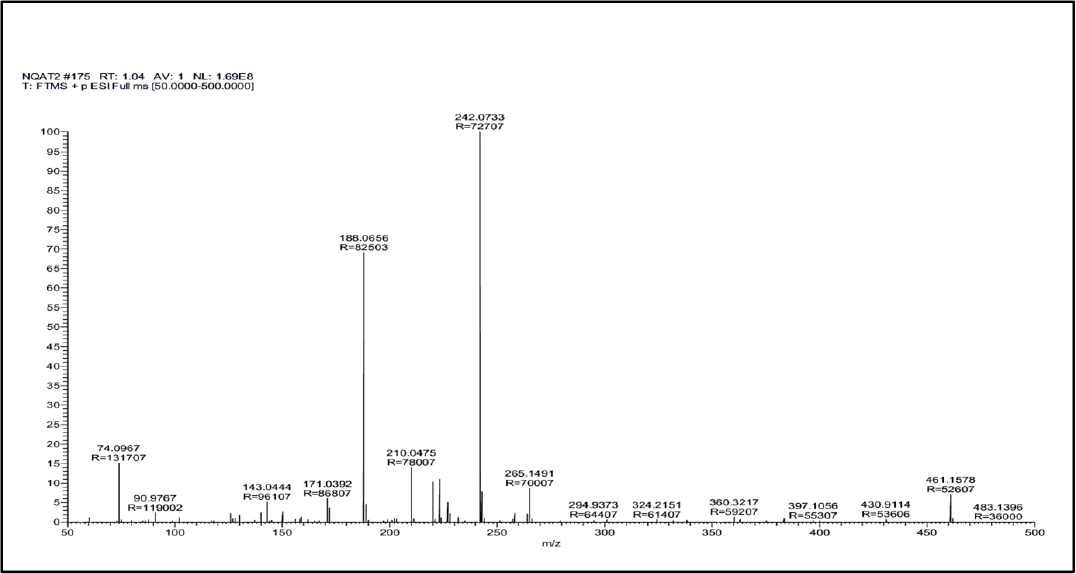
Figure 4a:
Mass Spectra of degradant product obtained at retention time 1.04 min.
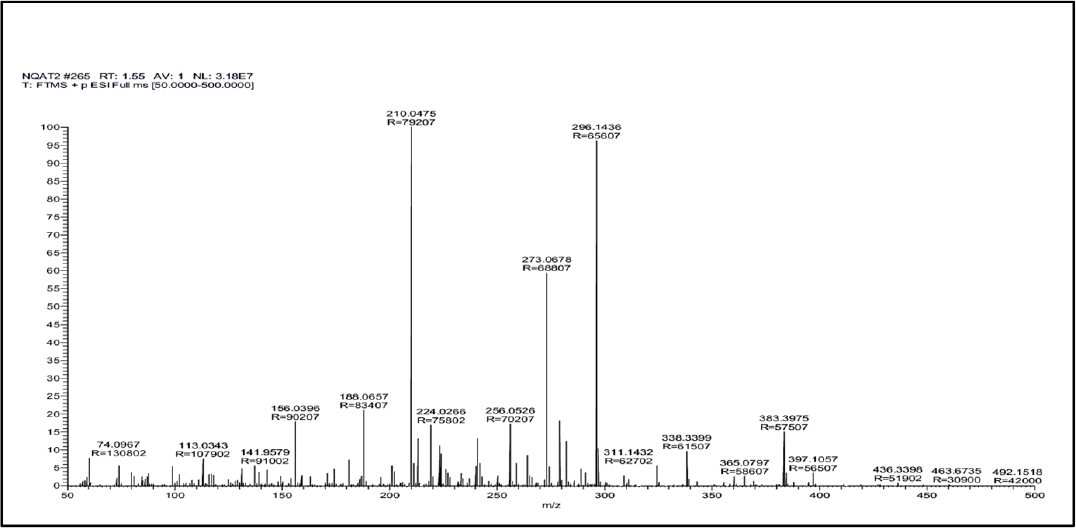
Figure 4b:
Mass Spectra of degradant product obtained at retention time 1.55 min.
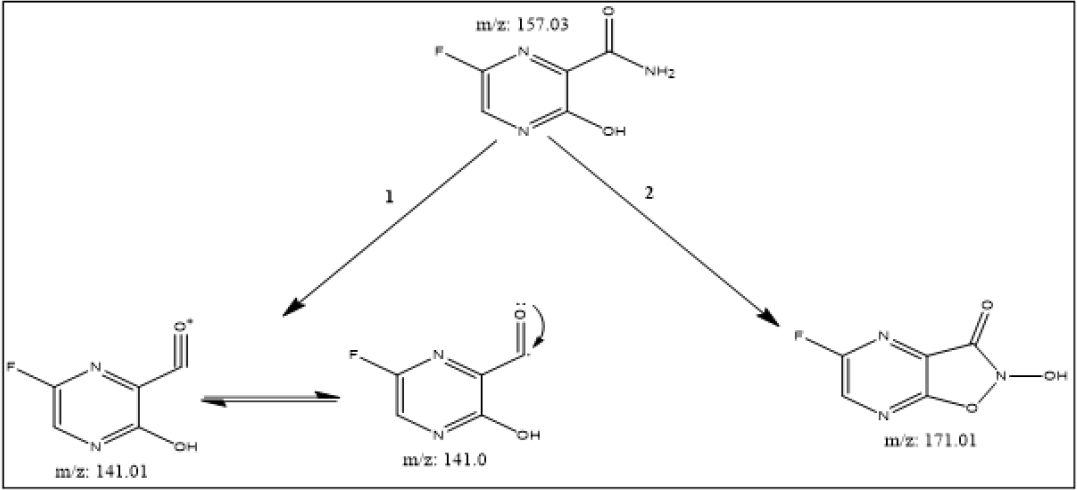
Figure 5:
Suggested degradation pathway of favipiravir in alkaline condition.
| Sl. No. | Parameters | Result | |
|---|---|---|---|
| 1 | Correlation Coefficient of CC | 0.9959 | |
| 2 | Linear Regression Equation | 2.7061x + 4695.4 | |
| 3 | Range | 800 – 4800 ng/band | |
| 4 | Limit of Detection | 30.2028 ng | |
| 5 | Limit of Quantification | 115.76 ng | |
| 6 | Robustness (%Recovery) | 101.45 – 103.34% | |
| 7 | Assay (n=6 at 3200ng/band) | %Recovery = 99.84 | |
| 10 | Intraday Precision (n=3) | Concentration | %RSD |
| 800 | 0.1946 | ||
| 3200 | 0.1556 | ||
| 4800 | 0.1072 | ||
| 11 | Interday Precision (n=3) | Concentration | %RSD |
| 800 | 0.0513 | ||
| 3200 | 0.4158 | ||
| 4800 | 0.1498 | ||
| 12 | Accuracy (n=3) | Concentration | %Recovery |
| 800 | 100.79 | ||
| 3200 | 99.51 | ||
| 4800 | 98.76 | ||
DISCUSSION
After carrying several trials and alteration in ratios of selected mobile phase component, Toluene: Methanol: Ethyl Acetate: Formic acid at ratio of 7: 1: 2: 0.5 respectively was found to be optimal to carried out further chromatographic development. FVP peak area and concentration exhibited a direct relationship at wavelength 325nm. The linearity was observed between 800-4800 ng/band with good correlation coefficient (r2=0.9959) in this above-mentioned concentration range with regression equation y=2.7061x+4695.4. The average recovered value of % Recovery indicated that developed densitometric method is more accurate for quantification of favipiravir. The observed results clarify that the developed method is sensitive with respect to LOD and LOQ. As per the observation small variations in the experimental parameter lead to insignificant change in Rf value and peak area of the analyte of interest, which indicates that the developed method is robust in nature. Favipiravir drug was found to be more susceptible for degradation in alkaline condition as shown in Table 5. Therefore, degradant of favipiravir resulted from alkaline condition were further subjected for the isolation and characterization by LC-MS analysis.
CONCLUSION
Stability indicating nature of the developed and validated HPTLC method is explored by force degradation approach reveals that favipiravir is more susceptible for alkaline degradation and well resolved separated peaks of favipiravir under various stress conditions indicates that developed HPTLC method is suitable to resolve possible degradants from favipiravir. Statistical report of developed HPTLC method indicates that developed HPTLC method is sensitive, accurate, selective and precise in nature and can be applied for quantification for Favipiravir in bulk and commercial film coated tablet.
References
- Cai Q, Yang M, Liu D, Chen J, Shu D, Xia J, et al. Experimental treatment with favipiravir for COVID-19: an open-label control study. Engineering (Beijing). 2020;6(10):1192-1198. [PubMed] | [CrossRef] | [Google Scholar]
- Irie K, Nakagawa A, Fujita H, Tamura R, Eto M, Ikesue H, et al. Pharmacokinetics of favipiravir in critically ill patients with COVID-19. Clin Transl Sci. 2020;13(5):880-5. [PubMed] | [CrossRef] | [Google Scholar]
- Furuta Y, Komeno T, Nakamura T. Favipiravir (T-705), a broad-spectrum inhibitor of viral RNA polymerase. Proc Jpn Acad Ser B Phys Biol Sci. 2017;93(7):449-63. [PubMed] | [CrossRef] | [Google Scholar]
- Madelain V, Nguyen TH, Olivo A, de Lamballerie X, Guedj J, Taburet AM, et al. Ebola virus infection: review of the pharmacokinetic and pharmacodynamic properties of drugs considered for testing in human efficacy trials. Clin Pharmacokinet. 2016;55(8):907-23. [PubMed] | [CrossRef] | [Google Scholar]
- Venkataraman S, Prasad BVLS, Selvarajan R.. RNA dependent RNA polymerases: insights from structure, function and evolution. Viruses. 2018;10(2):76 [PubMed] | [CrossRef] | [Google Scholar]
- Bulduk İ. HPLC-UV method for quantification of favipiravir in pharmaceutical formulations. Acta Chromatogr. 2021;33(3):209-15. [CrossRef] | [Google Scholar]
- Jyothi B J, Kavya R V. Ultraviolet spectrophotometric method development for estimation of new antiviral repurposing drug favipiravir. Asian J Pharm Clin Res.. 2021;14(7):67-9. [CrossRef] | [Google Scholar]
- Morsy MI, Nouman EG, Abdallah YM, Zainelabdeen MA, Darwish MM, Hassan AY, et al. A novel LC-MS/MS method for determination of the potential antiviral candidate favipiravir for the emergency treatment of SARS-CoV-2 virus in human plasma: application to a bioequivalence study in Egyptian human volunteers. J Pharm Biomed Anal. 2021;199:114057 [PubMed] | [CrossRef] | [Google Scholar]
- Achanta PS, Chen SN, Pauli GF. Plain 1 H nuclear magnetic resonance analysis streamlines the quality control of antiviral favipiravir and congeneric World Health Organization essential medicines. Magn Reson Chem. 2021;59(7):746-51. [PubMed] | [CrossRef] | [Google Scholar]
- . Guidance on analytical method validation. [PubMed] | [CrossRef] | [Google Scholar]

