ABSTRACT
Background
Teneligliptin is a new drug recently approved by FDA for treatment of type 2 Diabetes Mellitus (DMT 2). Very few methods have been reported for analysing its degradation products and their impact on human health.
Materials and Methods
A precise, specific, and sensitive gradient UHPLC technique was developed and validated to analyze Teneligliptin using an Agilent C18 column (4.6×100 mm ID) with 2.5 μm particle size. The method employs a flow rate 0.9 mL/min and detects the teneligliptin at a wavelength 241 nm. This method comprises a mobile phase consists a mixture of Methanol with 0.1% TEA (60:40%v/v), along with a 20 μL injection volume for duration of 20 min.
Results
Linearity was found in the range of 2-10 μg/ mL having a correlation coefficient of 0.999. The retention time for Teneligliptin was found to be 2.382. Furthermore, the precision and robustness of the method were validated with a remarkable RSD (Relative Standard Deviation) below 2%.
Conclusion
The method’s stability under various stress conditions was confirmed through forced degradation studies conducted on both bulk substances and pharmaceutical dosage forms. Validation of the method followed the guidelines outlined by the ICH for assessing the validation parameters like specificity, linearity, accuracy, precision, robustness, LOQ and LOD.
INTRODUCTION
Common endocrinological diseases, such as Type 2 Diabetes Mellitus (T2DM), are substantially expanding globally, presenting a significant concern. According to estimates, there will be more than 500 million diabetes patients by 2030 and over 700 million by 2045. A diverse metabolic disease, diabetes mellitus is characterized by abnormalities in the metabolism of fat, protein, and carbohydrates.1
The prevalence of diabetes and its linked cardiovascular issues has become widespread, necessitating immediate focus on pathways and biomolecules implicated in their development. Research has revealed that mutations in the Peroxisome Proliferator-Activated Receptor (PPAR)-γ contribute to the onset of metabolic syndrome in humans.2 Utilizing PPAR ligands shows promise in addressing metabolic disorders, diabetes, and the associated cardiovascular risks.3
In today’s world, diabetes and its most abnormal forms represent a serious health concern.4 A persistent metabolic illness characterized by high blood glucose is called diabetes. The most common sort of diabetes, type 2, mainly affects adults and is brought on by insufficient or resistant insulin production in the body.5,6 Teneligliptin, an antidiabetic medication categorized among dipeptidyl peptidase-4 inhibitors or gliptins,7 is chemically described as {(2S,4S)-4-[4-(3-methyl-1-phenyl-1H-pyrazol-5 -yl)-1-piperazinyl]-2-pyrrolidinyl} (1,3-thiazolidin-3-yl) methanone Figure 1. Its action spans 24 hr, working by increasing activated Glucagon-Like Peptide-1 (GLP-1) levels, thereby reducing post-meal hyperglycaemia.8,9 Patients with DMT2 who administered teneligliptin for 12 weeks showed a significant reduction in their Hemoglobin A1c (HbA1c), fasting blood glucose, and postprandial blood glucose levels. This medication had a promising impact in reducing the risk of diabetes complications and regulating glycemic variations throughout the day.10
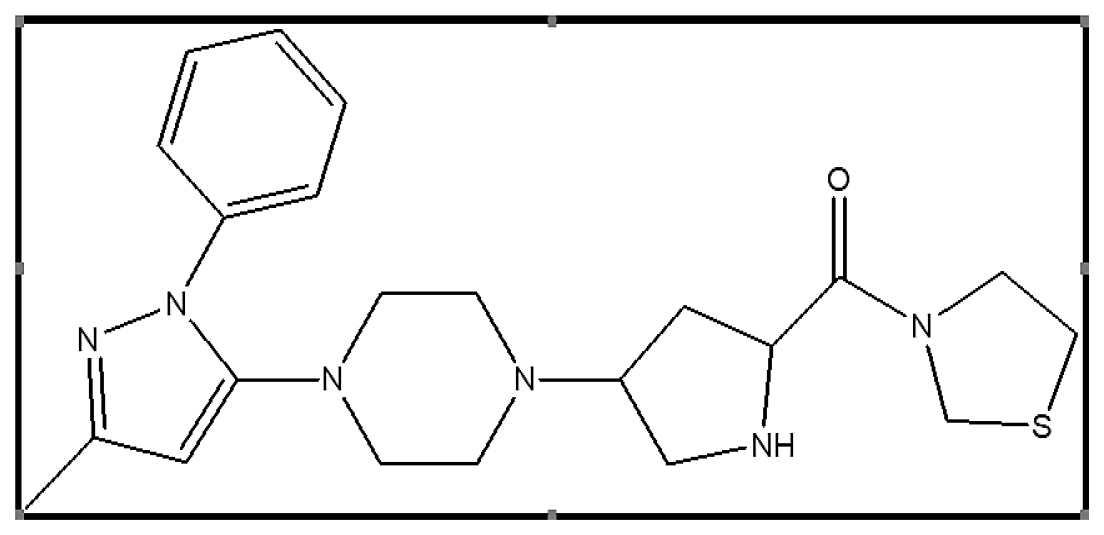
Figure 1:
Chemical structure of Teneligliptin.
Conducting stability assessments for both the Active Pharmaceutical Ingredient (API) and its formulation stands as a critical component in formulating development, aimed at reducing degradation and determining suitable storage conditions. The ICH guidelines specifically mandate performing forced decomposition studies involving diverse conditions such as extreme PH, light exposure, oxidation, and dry environments heat, etc. and separation of drug from degradation products.11
Multiple analytical methods have been reported for the determination of Teneligliptin both independently and in combination with other drugs. They include spectrophotometric methods RP-HPLC,12–14 HPTLC,15–17 stability indicating HPLC method by UV Spectroscopy.18,19
MATERIALS AND METHODS
Instrumentation
Agilent C18 (2.5 μm; 4.6×100 mm ID.) column was used in the High-Performance Liquid Chromatography (HPLC) of Agilent 1100 inbuilt with reciprocating pump (HP-1100) equipped with UV detector throughout the analysis. The chemstation software was used for controlling and analysing data from chromatography system. Digital pH meter (EQ-610, Lab line) was used to check the PH of the sample. Digital weighing balance (ME-204) purchased from Mettler-Toledo (USA), ultra-sonicator of Labman used to dissolve the undissolved particle OD drug. 0.20 μ and 0.45 μ nylon membrane filters were purchased from Phenomenex® Mumbai, India.
Determination of working Wavelength
The spectrophotometric was used to identify the wavelengths at which the drug shows significant absorption. The wavelength where the drug exhibits the highest absorbance or a strong absorption peak is typically chosen for HPLC analysis.
Selection of Mobile Phase
The mobile phase selection process involved consideration of buffer type, buffer pH, solvent selection and ratio of buffer and solvent. Teneligliptin standard solution was separately injected into the HPLC system using various solvent systems, including Methanol: water (90:10), Methanol: 0.1% OPA (80:20), Methanol: 0.1% TEA (75:25), Methanol: 0.1% TEA (60:40), Methanol: water (60:40), and Methanol: water (50:50). Among these, Methanol: 0.1%TEA showed promising results for the separation.
After testing different ratios, the optimized mobile phase for the accurate determination for the drug was found a mixture of Methanol: 0.1% TEA (PH-6 WITH OPA) 60: 40 %v/v. This specific combination provided the ideal conditions for effective separation and precise analysis of Teneligliptin in the HPLC system.
Preparation of Standard Solution
20 mg Teneligliptin was precisely weighed and dissolved in 100 mL of methanol to achieve concentrations of 200 μg/mL, respectively. The solution is sonicated for 2-5 min. The solution containing Teneligliptin 200 μg/mL is prepared for assessing robustness, accuracy, repeatability, and other validation parameters.
Preparation of Sample Solution
20 tablets were initially weighed to establish their average weight. Then the tablets were ground into a fine powder using a mortar and pestle. The resultant powder weighed carefully and transferred into a 100 mL volumetric flask, equivalent to 20 mg of Teneligliptin. Then 100 mL methanol is added as a diluent and sonicating the sample for 15 min to remove air bubble. The volume was further adjusted by adding additional diluent to the solution to attain a concentration of 200 μg/mL of Teneligliptin.
Preparation of Buffer
100 mL HPLC-grade water and 0.1 g of triethylamine are mixed to make 0.1% triethylamine buffer. PH is adjusted to 6 with OPA.
Validation Parameters
System Suitability Studies
Six injections of a working standard solution containing Teneligliptin at a concentration of 20 μg/mL was injected and analysed under optimized chromatographic conditions. This was conducted to assess the consistency of results with respect to the relative Standard Deviation (RSD), which should consistently remain below 2%. Furthermore, various system suitability parameters, such as retention or capacity factor (k’), Resolution (Rs), theoretical plates (N), tailing factor/peak Asymmetry (As), and separation factor, were examined and assessed.
Linearity
Linearity denotes the capacity of a method or instrument to yield results that exhibit consistent relationship with the varying concentrations or amount of the analyte being measured across a range of concentrations. In these five different concentrations are used to determine the linearity.
Drawing a graph where the y-axis represent the peak areas and X-axis represent the concentrations over the concentration ranges of 2-10 μg/mL for Teneligliptin produced the calibration curve plots for TEN. It is desirable for the correlation coefficient to exceed 0.99.
Accuracy
The accuracy of the method was assessed by conducting recovery experiment, where a precise quantity of the drug was introduced into the sample solution. The recovery was assessed by measuring the drug’s recovered amount based on the peak areas. The sample mix with standard drug at concentrations of 80%, 100% and 120% of the original concentrations. The mixed sample was analysed in triplicate. The expected range for percentage recovery at each level was set between 98% and 102%.
Precision
Precision refers to the consistency and reproducibility of results obtained from repeated measurements under similar conditions, indicating the reliability and consistency of the analytical method or instrument. The Relative Standard Deviation (RSD) or Standard Deviation (SD) is used to express it. This involves conducting repeated measurements under defined conditions using multiple samples of the same uniform sample.
Method precision
Method precision represents the capacity of an analytical method or instrument to generate consistent and reproducible results through multiple measurements under similar conditions, emphasizing the method’s reliability.
Intermediate Precision
The peak areas of three replicates of the sample solutions were measured the same day they were injected under ideal circumstances. The three replicate injection results peak areas RSD% shouldn’t be more than 2.
Repeatability
Repeatability refers to the agreement or consistency observed between independent test result obtained under identical experimental conditions It assesses the precision of a method by evaluating the consistency of results when the same procedure is applied repeatedly by the same operator, using the same equipment, and within a short timeframe. Essentially, it measures the ability of a method to produce consistent and nearly identical results when applied to the same sample multiple times under the same conditions. This parameter determines the reliability and consistency of an analytical method.
Assay
Assay method is used to analyze and determine the presence, concentration or activity of substance such a drug, molecule or biological component in a sample. Assay is done by crushing the 20 tablets of teneligliptin and determining their average weight. An amount equivalent to 20 ppm was prepared and injected for analysis. The results are obtained by comparing the peak areas of both standard and sample solution.
Robustness
Robustness of a chromatographic method by deliberately altering parameters like flow rate, wavelength, and mobile phase pH, it’s common to observe impacts on various chromatographic parameters. These alterations can affect different aspects of the chromatographic separation, and monitoring parameters like retention pattern, theoretical plates (N), peak area, Tailing factor (Tf), Resolution (Rs), capacity/retention factor (k’), and separation factor allows for a comprehensive assessment of the method’s robustness.
Specificity
Specificity indicates the capability of a method to accurately and exclusively measure the desired analyte without being interfered by other components within the sample matrix.
The purpose of this study is to validate the method specificity by analyzing both blank sample and placebo using the HPLC system under optimal conditions. This study aims to ensure that there are no interfering peaks present in the chromatograms of these samples specifically focusing on the retention times associated with the selected drugs.
Ruggedness
The degree of reproducibility obtained by examining variety of normal test conditions like different days or different analysts directly compares the reproducibility of test results to the precision of the assay. This comparison serves as a direct indicator of the method’s ruggedness.
LOQ
LOQ is the lowest amount of an analyte that can be accurately quantified with acceptable accuracy and reliability. LOQ typically involves a higher signal-to-noise ratio than LOD and indicates the point where quantitative measurements can be made with a defined level of precision and accuracy.
LOD
The limit of detection represents the minimum concentration of an analyte that is detectable although not necessarily quantifiable. It’s evaluated by measuring the signal-to-noise ratio, where the signal from the analyte is compared to the background noise level.
Forced Degradation Study
Force degradation study involves introducing the sample to the various stress conditions for potential degradation that may occur during the storage conditions. The aim is that to understand the how subject reacts, changes or degrades under various stress conditions.
Force degradation study mainly conducted in pharmaceutical research to evaluate the stability and degradation pathway of drug and drug products. In this study sample undergoes various stress conditions such as acid, base, oxidative and neutral degradation.
Acid Degradation
0.3 mL of teneligliptin stock solution was mixed with 5 mL of 0.1N HCl was added followed by makeup volume upto 10 mL with mobile phase. The resulting stock solution allowed remaining exposed for 24 hr. After 24 hr the Sample was neutralized with 0.1 N NAOH before injection.
Base Degradation
Mix 0.3 mL of teneligliptin stock solution with 5 mL of 0.1 N NAOH and adjust the volume upto 10 mL with mobile phase. Let the stock solution exposed for 24 hr. Afterward, neutralized the sample with 0.1 N HCl prior injections.
Oxidative (H2O2) Degradation
0.3 mL of stock solution of Teneligliptin is added in 10 mL volumetric flask with 5 mL of 3% H2O2. Then volume is adjusted to 10 mL with mobile phase and stock solution is exposed for 24 hr. Then analysis was carried out.
Neutral
Combine the 0.3 mL of stock solution of Teneligliptin with 5 mL of water. 10 mL volume is made up with mobile phase in volumetric flask. After exposing the stock solutions for 24 hr proceed for the analysis.
RESULTS
A rapid UHPLC method was developed to analyse teneligliptin using various mobile phase ratio, chromatographic conditions, and flow rates. Optimal conditions of methanol: 0.1% TEA (PH 6 with OPA) at a ratio of 60:40, Agilent C18 (2.5μm; 4.6×100 mm Length) and a flow rate of 0.9 mL/min yielded satisfactory results represented in Table 1. The system suitability parameters including tailing factor retention time and theoretical plates fulfilled the predefined acceptance criteria depicted in Table 2. Specificity was confirmed with no interfering peaks observed at teneligliptin retention time represented by Figure 2. Linearity was assessed in the range of 2-10 μg/mL which exhibited a correlation coefficient of 0.999 illustrated in Table 3 and Figure 3.
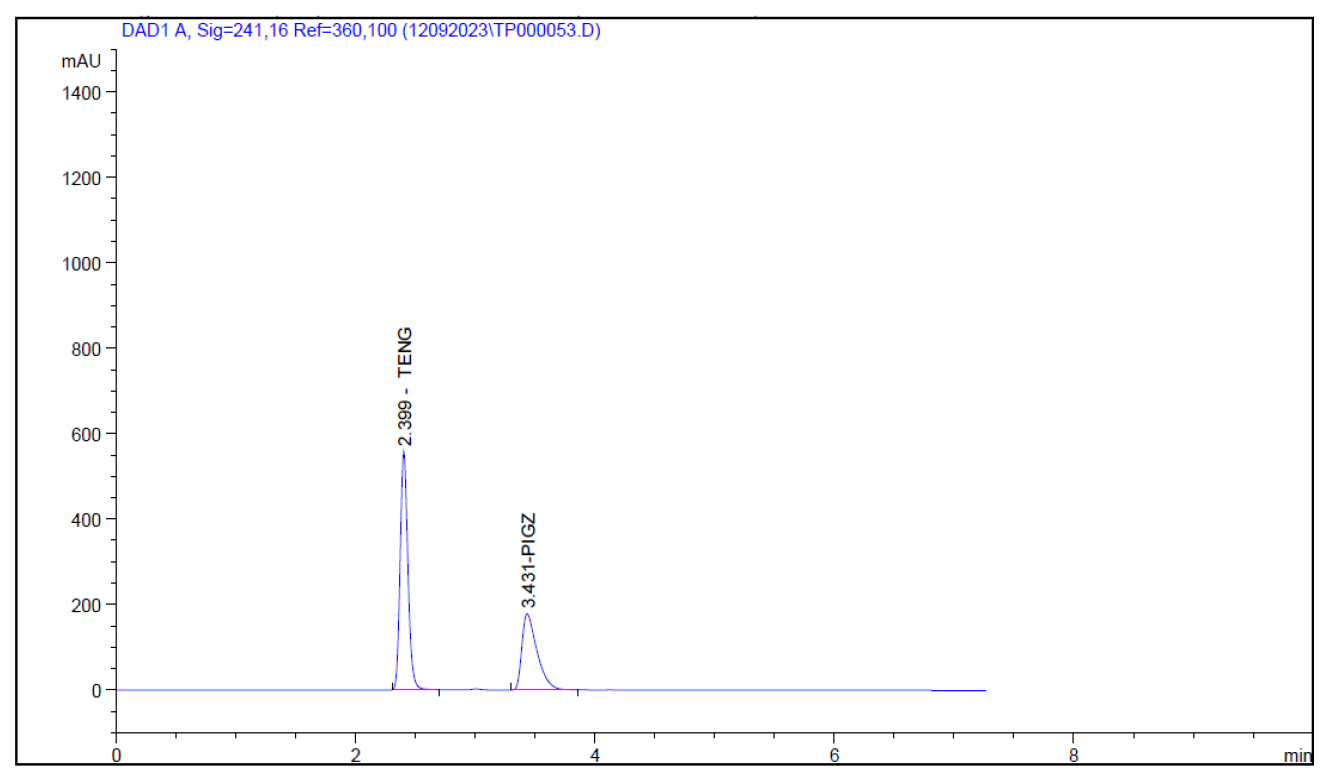
Figure 2:
Chromatogram showing resolved peaks of Teneligliptin.
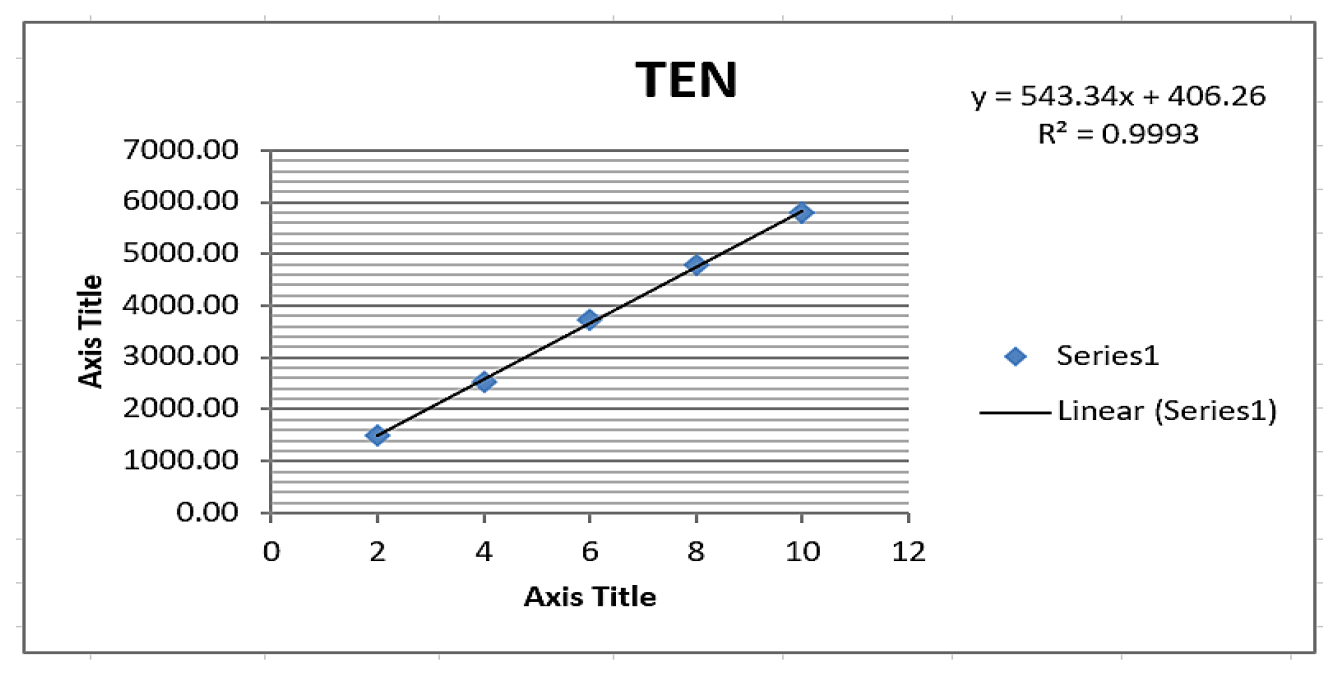
Figure 3:
Linearity plot of Teneligliptin.
| Parameters | Chromatographic condition |
|---|---|
| Mode of elution | Isocratic |
| Mobile Phase | Methanol: 0.1% TEA (PH 6 WITH OPA); 60:40 |
| Column | Agilent C18 (2.5 μm; 4.6×100 mm Length) |
| Flow Rate | 0.9 mL/min |
| Runtime | 10 min |
| Injection Volume | 20 μL |
| Detection Wavelength | 241 |
| Temperature | 33°C |
Optimized chromatographic conditions.
| Parameters | Teneligliptin | Acceptance criteria |
|---|---|---|
| Tailing factor | 0.78 | ≥2 |
| Retention time | 2.382 | ≤2 |
| Theoretical plates | 6503 | ≤2000 |
Summary of system suitability parameters for teneligliptin.
| Parameters | Teneligliptin |
|---|---|
| Linearity range (μg/mL) | 2-10 |
| Regression coefficient±SD | 0.999±13.89 |
| Slope±SD | 543.34±13.89 |
| Intercept±SD | 406.2±13.89 |
Linearity values of Teneligliptin.
Recovery rates for teneligliptin ranged between 99.46%-102.87%, aligning with guidelines specifications showed in Table 4. Method precision showed %RSD values not exceeding 2%. Ruggedness evaluated across analysts and days, exhibited consistent results represented in Table 5. Precision i.e. Intraday and Interday precision is represented in Table 6 and 7. Robustness study indicated no significant variations as showed in Table 8. Assay results of Teneligliptin in marketed formulations matches with labelled claims represented in Table 9. Limit of detection and Limit of quantification values were determined from the slopes and standard deviation represented in Tables 10 and 11.
| Level | amount added (μg/mL) | Recovered amount (μg/mL) | Mean % recovery | RSD % |
|---|---|---|---|---|
| 80% | 1.6 | 1.62 | 101.55 | 0.08 |
| 100% | 2 | 2.05 | 102.87 | 0.04 |
| 120% | 2.4 | 2.38 | 99.46 | 0.03 |
Recovery values of Teneligliptin.
| Peak area at Analyst-1 | Peak area at Analyst-2 | SD | RSD% |
|---|---|---|---|
| 2526.79 | 2528.5166 | 1.882 | 0.048 |
Ruggedness values of Teneligliptin.
| Sl. No. | Conc. (μg/mL) | Area Mean±SD (n=3) | %RSD |
|---|---|---|---|
| 1. | 6 | 3647.22±1.32 | 0.04 |
| 2. | 8 | 4850.10±68.62 | 1.41 |
| 3. | 10 | 5745.16±63.81 | 1.11 |
Intraday Precision.
| Sl. No. | Conc. (μg/mL) | Area Mean±SD (n=3) | %RSD |
|---|---|---|---|
| 1. | 6 | 3657.18±0.57 | 0.02 |
| 2. | 8 | 4836.37±2.37 | 0.05 |
| 3. | 10 | 5736.10±0.70 | 0.01 |
Interday Precision.
| Chromatographic Condition | Changes | Theoretical plate | Tailing Factor | Resolution |
|---|---|---|---|---|
| Flow (-0.1 mL/min) | 0.8 | 7269 | 0.87 | – |
| Flow (+0.1 mL/min) | 1.0 | 6226 | 0.87 | – |
| M.P (-0.1 mL/min) | 59+41 | 6751 | 0.86 | – |
| M.P (+0.1 mL/min) | 61+39 | 6736 | 0.87 | – |
| Wavelength (-1) | 240 | 6980 | 0.88 | – |
| Wavelength (+1) | 242 | 6980 | 0.88 | – |
Robustness values of Teneligliptin.
| Drug | Teneligliptin |
|---|---|
| Label claim | 20 mg |
| Amount found | 19.94 |
| % Assay | 99.72 |
Assay results of marketed formulation (Zita plus Pio).
| Teneligliptin |
|---|
| LOD=3.3 X Avd.SD/ Slope |
| =45.8321782 |
| =0.084358878 |
Limit of Detection data for Teneligliptin.
| Teneligliptin |
|---|
| LOQ=10X Avd.SD/Slope |
| =138.8853885 |
| =0.25563296 |
Limit of Quantitation data for Teneligliptin.
In the forced degradation study standard solution is subjected to different stress conditions as outlined in the procedure. Acidic condition prompted approximately 1.60% degradation for teneligliptin Figure 4. Alkaline conditions induced roughly 3.14% degradation for teneligliptin Figure 5. Oxidative conditions resulted in about 6.02% degradation for teneligliptin Figure 6. Neutral conditions incurred less than 1% degradation for drug Figure 7. The comprehensive outcomes of the forced degradation study are showed in Table 12.
| Sl. No. | Degradation | Area of degraded sample | % Recovery | %Degradation |
|---|---|---|---|---|
| 1. | Acid Degradation | 3618.60 | 98.40 | 1.60 |
| 2. | Basic Degradation | 3562.23 | 96.86 | 3.14 |
| 3. | H2O2 Degradation | 3456.16 | 93.98 | 6.02 |
| 4. | Neutral | 3656.36 | 99.42 | 0.58 |
HPLC data for degradation study of Teneligliptin.
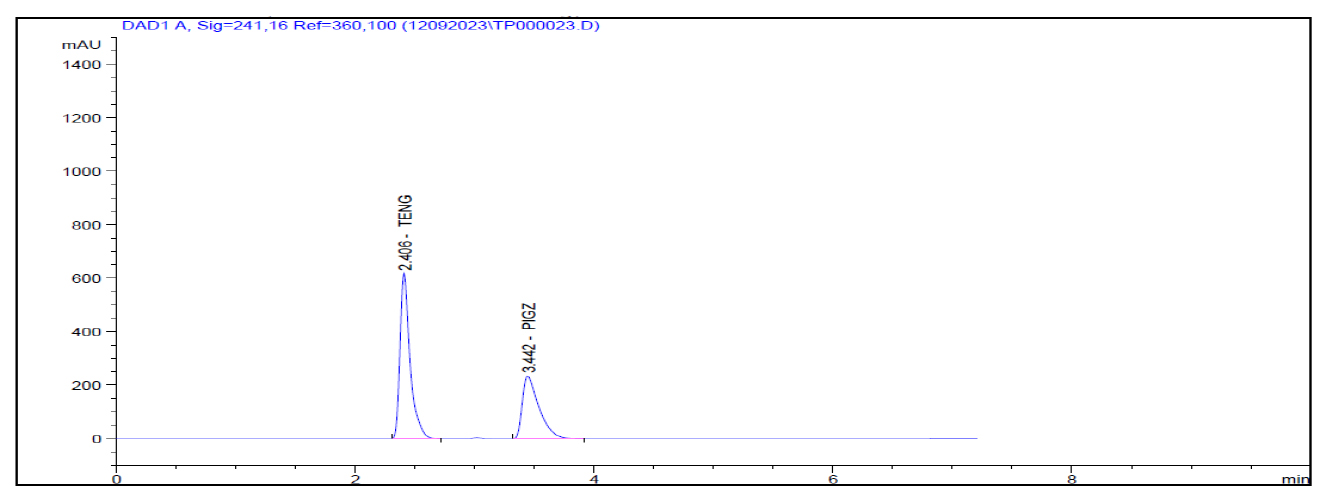
Figure 4:
HCL Degradation.
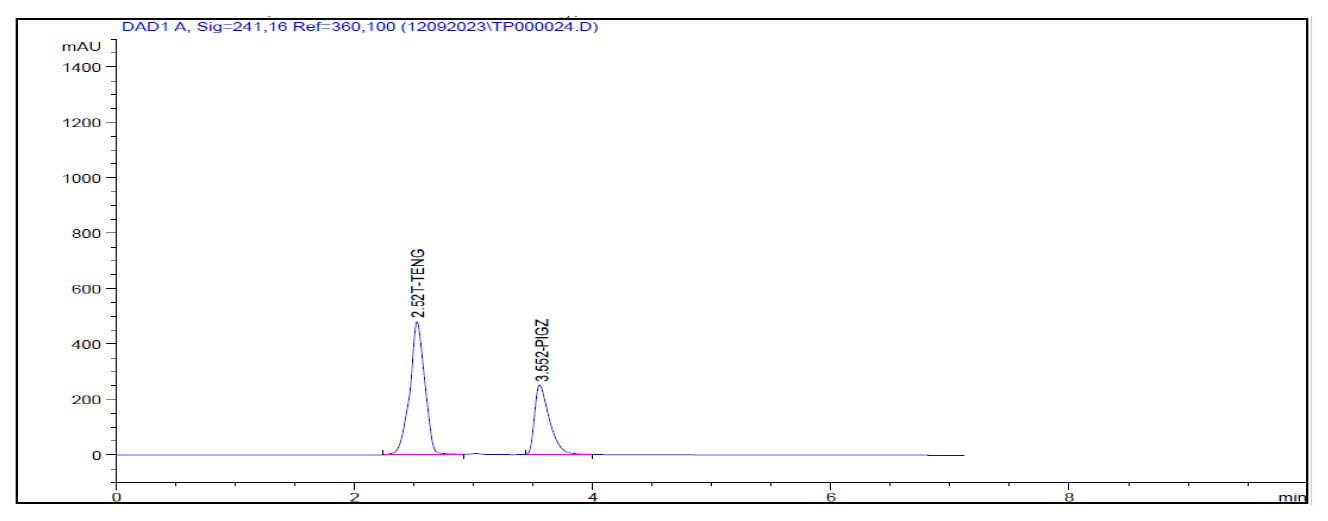
Figure 5:
NAOH Degradation.
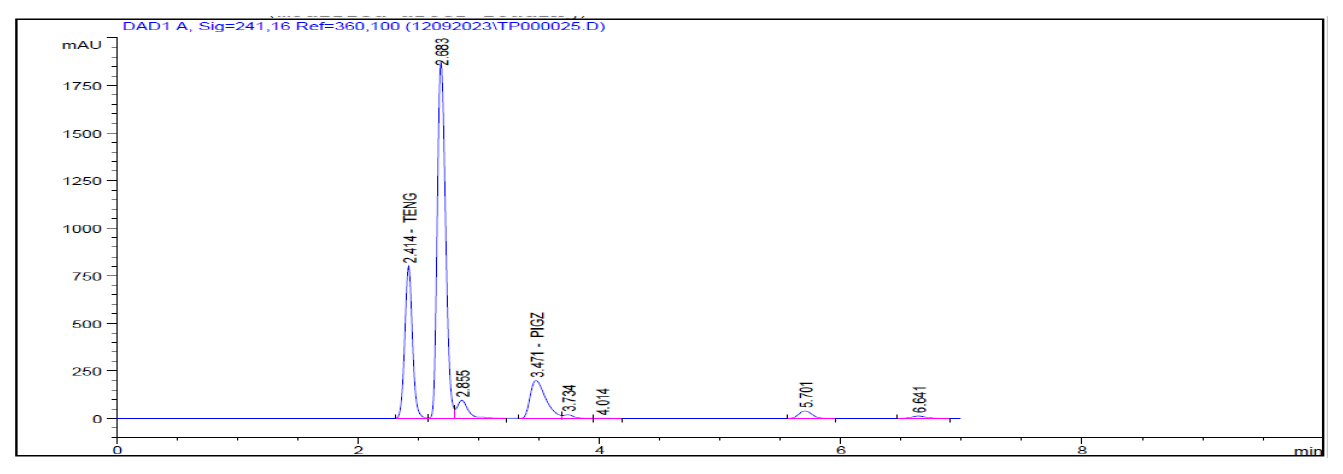
Figure 6:
H2O2 Degradation.
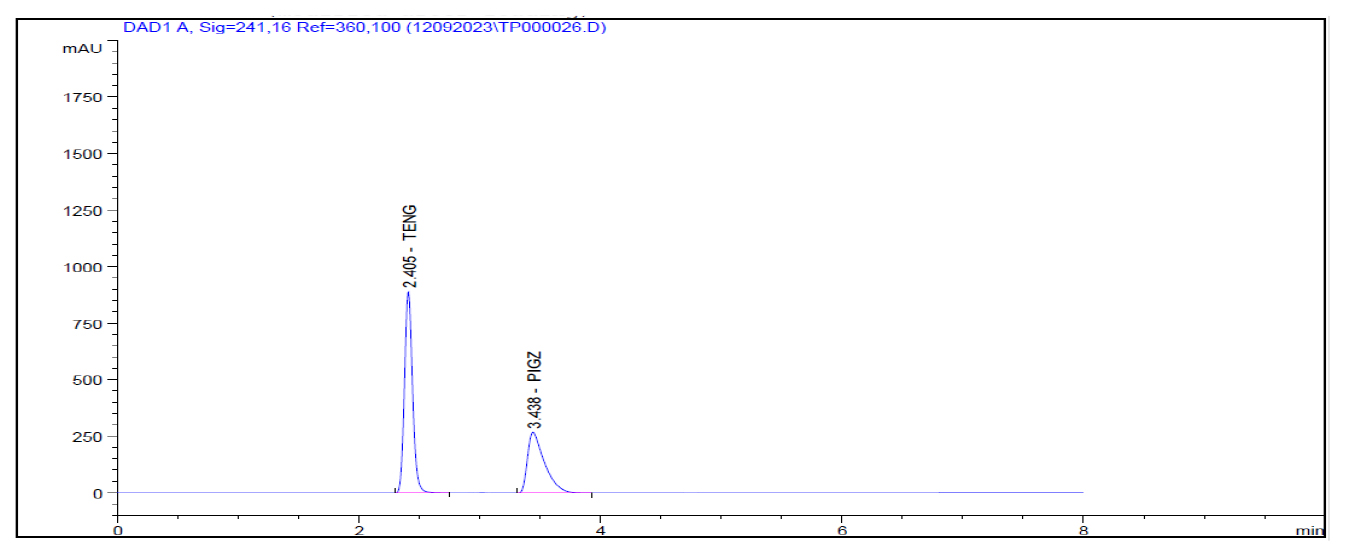
Figure 7:
Neutral Degradation.
DISCUSSION
Teneligliptin is a recently FDA approved antidiabetic medicine and very few information is available regarding stability and potential degradation. This research paper aims to conduct stability studies on teneligliptin focusing on the development and validation of new UHPLC method according to guidelines of International Conference on Harmonization for the identification and estimation of teneligliptin. This method served as a stability indicating approach, using pure teneligliptin introduced to stress condition like acidic, basic, neutral and oxidative. There is very low degradation observed under acidic and neutral condition of HPLC analysis. However, in the presence of base and peroxide, the sample shows the maximum degradation as compared to acidic and neutral condition.
During method development various mobile phases like Methanol: water (90:10), Methanol: 0.1% OPA (80:20), Methanol: 0.1% TEA (75:25), Methanol: water (60:40), and Methanol: water (50:50) was tested. However, the desired peak resolution was not obtained. Finally, it was found that Methanol: 0.1% TEA (60:40%v/v), gave favorable peaks and hence accepted as mobile phase. An Agilent C18 (4.6×100 mm, 2.5μm) column with 0.9 mL flow rate and 20 μL injection volume at 33°C and 241 nm was fixed which is already identified by UV, which were fixed as optimized conditions for suitable separation of peaks. By this developed method the retention time for teneligliptin was determined to be 2.382 min.
CONCLUSION
The forced degradation study conducted to assess Teneligliptin using the UHPLC method provided the valuable insights into its stability under various stressed condition. The method demonstrated under various stress condition like acidic, Basic, Neutral and oxidative to identify their degraded products during storage condition offers understanding of teneligliptins susceptibility to degradation.
The developed UHPLC method enables the determination of teneligliptin in pure and pharmaceutical formulation form. This method offering advantages in terms of speed, convenience, precision and accuracy. In comparison with other existing reported method this approach is deemed more cost-effective. It is applicable to tablet analysis and a great choice for the routine quality control analysis of teneligliptin and its pharmaceutical formulation.
Cite this article
Godase SN, Vikhe KB, Kolhe MH, Mhaske SB, Bhor RJ, Gawali PS. Stability Indicating Method Development and Validation of Teneligliptin by UHPLC Method in Bulk and Pharmaceutical Dosage Form. Int. J. Pharm. Investigation. 2024;14(2):585-92.
ACKNOWLEDGEMENT
The authors extends the sincere gratitude to Swapnroop Pharmaceuticals for their generous provision of the gift sample of Teneligliptin.
ABBREVIATIONS
| ICH | International Council for Harmonisation |
|---|---|
| UHPLC | Ultra High Performance Liquid Chromatography |
| TEA | Triethylamine |
| OPA | Ortho-Phosphoric Acid |
| DMT2 | Diabetes Mellitus Type 2 |
| FDA | Food and Drug Administration |
| TEN | Teneligliptin |
| HPLC | High Performance Liquid Chromatography |
| HPTLC | High-Performance Thin-Layer Chromatography |
| RP-HPLC | Reverse Phase High Performance Chromatography |
| LOD | Limit of Detection |
| LOQ | Limit of Quantification |
| RSD | Relative Standard Deviation |
| S.D | Standard Deviation |
| M.P | Mobile Phase |
References
- David Blessing Rani J, Asha Deepti C. Method development, validation and forced degradation studies of new rp-hplc method for simultaneous estimation of remogliflozin and teneligliptin in pure and tablet dosage form. Int J Pharm Sci Res. 2023;14(7):3452 [CrossRef] | [Google Scholar]

- Sengupta P, Chatterjee B, Mandal UK, Gorain B, Pal TK. Development and validation of a high throughput LC-MS/MS method for simultaneous quantitation of pioglitazone and telmisartan in rat plasma and its application to a pharmacokinetic study. J Pharm Anal. 2017;7(6):381-7. [PubMed] | [CrossRef] | [Google Scholar]

- Jay MA, Ren J. Peroxisome proliferator-activated receptor (PPAR) in metabolic syndrome and type 2 diabetes mellitus. Curr Diabetes Rev. 2007;3(1):33-9. [PubMed] | [CrossRef] | [Google Scholar]

- Biswas B, Kumar M, Sharma JB, Saini V, Bhatt S. Method development and validation for estimation of teneligliptin in tablet dosage form by rp-hplc. Res J Pharm Technol. 2020;13(4):1774-8. [CrossRef] | [Google Scholar]

- Santosh J, Sanjay P, Virendra Y, Ashpak T. Zero Order and Area under Curve spectrophotometric methods for determination of atenolol in Pharmaceutical Formulation. Res J Pharm Forms Technol. 2015;7(3):185 [CrossRef] | [Google Scholar]

- Chaurasia A, Kharya M. Evaluation and marker quantification of antidiabetic herbal tablets:SteviTab and AndroTab by HPLC method. Res J Pharm Forms Technol. 2013;5(1) [CrossRef] | [Google Scholar]

- Teneligliptin KM. A DPP-4 inhibitor for the treatment of type 2 diabetes. Diabetes Metab Syndr Obes. 2013;6:187-95. [CrossRef] | [Google Scholar]

- RaoS S, BegumK A, Srinivasa Rao S. Analytical method development and validation of teneligliptin and metformin HCl by using RP-HPLC method [internet]. J Global Trends Pharm Sci. 2020:11 Available fromhttps://www.jgtps.com/
[CrossRef] | [Google Scholar]
- Available fromhttps://go.drugbank.com/drugs/DB11950

- Ganesh Kumar TNV, Vidyadhara S, Narkhede NA, Sai Silpa Y, Rajya Lakshmi M. RETRACTED ARTICLE: Method development, validation, and stability studies of teneligliptin by RP-HPLC and identification of degradation products by UPLC tandem mass spectroscopy. J Anal Sci Technol. 2016;7(1) [CrossRef] | [Google Scholar]

- Borade B, Dighade S. Robust simple analytical technique for development and validation of stability indicating assay method for estimation of teneligliptin in pharmaceutical to dosage form. Int J Pharm Sci Res. 2022;13(8):3280-7. [CrossRef] | [Google Scholar]

- Luhar SV, Patel KR. BNarkhede S. Stability study of gemigliptin and simultaneous estimation of gemigliptin and its degradation product by RP-HPLC method. J Pharm SciBioscientific Res [Internet]. 2016;6(3):338-46. [CrossRef] | [Google Scholar]

- Vetapalem R, Yejella RP, Atmakuri LR. Development and validation of a stability indicating rp-hplc method for simultaneous estimation of teneligliptin and metformin. Turk J Pharm Sci. 2020;17(2):141-7. [PubMed] | [CrossRef] | [Google Scholar]

- Patel DB, Bhavya MB, Chaudhary A. Method development and validation for simultaneous estimation of Lamivudine and Zidovudine in tablet by reverse-phase high-performance liquid chromatography. Asian J Pharm Clin Res. 2020;13(6):73-7. [PubMed] | [CrossRef] | [Google Scholar]

- Lodha S. Development and validation of HPTLC method for estimation of Teneligliptin hydrobromide hydrate in tablet doses form. J Pharm Appl Sci. 2016;3(1) [PubMed] | [CrossRef] | [Google Scholar]

- Patel VB, Patel JS, Shah DA. Estimation of metformin hydrochloride and teneligliptin in pharmaceutical formulation by high performance thin layer chromatography. Indian Drugs. 2018;55(10):34-9. [CrossRef] | [Google Scholar]

- Patel M, Patel D, Shah U, Kachhiya HM. Simultaneous quantification of teneligliptin hydrobromide and metformin hydrochloride: an improved HPTLC method with implementation of Plackett-Burman design. J Chem Metrol. 2021;1(1):65-75. [CrossRef] | [Google Scholar]

- Sen DB, Sen AK, Zanwar AS, Pandey H, Maheshwari RA. UV spectrophotometric methods to quantify alogliptin benzoate and pioglitazone hydrochloride. J Pharm Res Int. ;2021:31-41. [CrossRef] | [Google Scholar]

- Maruthi R, Chandan RS, Barath M, Datta GN, D’silva M, Kumari KM, et al. Analytical method development and validation of teneligliptin by UV spectroscopy. Res J Pharm Technol. 2021;14(1):75-8. [CrossRef] | [Google Scholar]


