ABSTRACT
Objectives
A straightforward, accurate, and precise reverse-phase high-performance liquid chromatography method was developed to determine the quantity of Lobeglitazone in both bulk and pharmaceutical dosage forms.
Materials and Methods
The chromatographic separation was achieved on a Phenomenex Luna column with dimensions of 250 cm×4.6 mm×5 μm, and the mobile phase was a combination of potassium dihydrogen orthophosphate and acetonitrile in a 70:30 V/V ratio with a pH of 4.0, adjusted using orthophosphoric acid. The flow rate was set at 1.0 mL/min, and detection of the effluents occurred at 250 nm.
Results
The retention time for Lobeglitazone was determined to be 2.157 min. The drug exhibited linearity within the concentration range of 10-60 μg/mL, the correlation coefficient was established to be 0.9996. The LOD, LOQ were found to be 0.8 μg/mL and 2.5 μg/mL. The accuracy of the method was considered satisfactory and the mean recovery percentage is found to be in the acceptable range of 99.78-101.31%.
Conclusion
The HPLC method was successfully developed, validated as per ICH guidelines. The proposed method was simple, precise, sensitive, rapid, robust for the estimation of Lobeglitazone in both bulk and tablet dosage forms.
INTRODUCTION
xsType 2 Diabetes Mellitus (T2DM) is a chronic, progressive metabolic disorder. It has long-term effects on the body, characterised by insulin resistance and β-cell dysfunction.1 T2DM is a complex and multifactorial disease involving a number of underlying mechanisms. As a result, there are multiple approaches available to manage the condition.2 There are several classes of Oral Anti-Diabetic agents (OADs) available, but the Thiazolidinedione (TZD) class stands out because it primarily targets insulin resistance.2 The TZDs improve insulin sensitization and enhance glucose and lipid metabolism by activating the proliferator-activated receptor γ (PPARγ).3 In type 2 diabetes, rosiglitazone and pioglitazone are the most commonly used drugs for better glycemic control by promoting insulin sensitivity. Due to cardiovascular and bladder cancer risks, their use has declined in recent years.4 The newly developed thiazolidinedione “lobeglitazone” (Chong Kun Dang Pharmaceutical Corporation, Seoul, Korea) provides a safer and more effective alternative to existing TZDs.5 It works similarly to pioglitazone on glycemic control but requires lower doses. Furthermore, clinical studies have indicated positive results in terms of safety, addressing some of the concerns associated with other TZDs. Since July 2013, it has been used in Korea as a treatment for T2D due to its pleiotropic effects in pre-clinical and clinical studies.6,7 As a pharmacophore, lobeglitazone consists of a 2,4-thiazolidinedione group bound to an ethoxy-benzyl N-methylamino group (Figure 1). Its structural formula is C24H24N4O5S, and the chemical name is 5-[4-(2-{[6-(4-Methoxy- phenoxy)-pyrimidin-4-yl]-methyl-amino}-ethoxy)- benzyl]-thiazolidine-2,4-dione hydrosulphuric acid.8
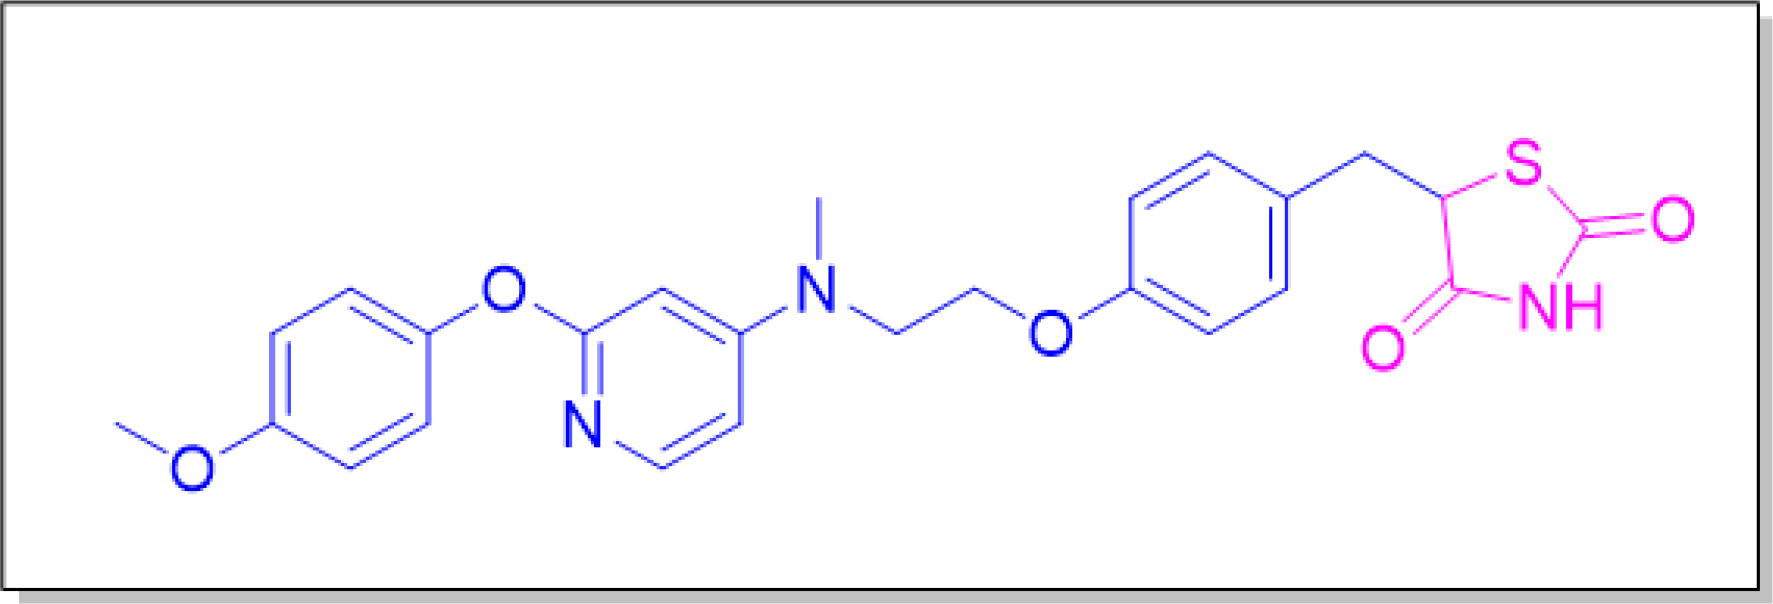
Figure 1.
Chemical structure of Lobeglitazone.
Lobeglitazone tablets are available on the market under the brand name Lobg (Glenmark Pharmaceuticals Ltd.). Jong-Hwa Lee et al. developed a validated assay using liquid chromatography and tandem mass spectrometry to perform pharmacokinetic studies of Lobeglitazone in rats.9 Gulhane et al., developed a bioanalytical method for the estimation of Lobeglitazone in human plasma.10 The literature survey indicates that other than a few bioanalytical methods, no method has been reported so far for estimating Lobeglitazone in pharmaceutical dosage forms.
Analytical methods keep evolving as requirements change so that they are simple, reliable, cost-effective, reproducible, and, above all, accurate and precise. Our study aimed to develop a rapid, robust, selective, sensitive, and precise isocratic RP-HPLC method for the determination of Lobeglitazone (LOBGL) in tablet dosage forms. The assay method was validated using ICH guidelines.11 The linearity, accuracy, precision, specificity, Limit of Detection (LOD), and Limit of Quantification (LOQ) were used for the determination of the drug content of the LOBGL in pharmaceutical products.
MATERIALS AND METHODS
Instruments
The analysis was performed using an HPLC system, specifically the Shimadzu HPLC model (VP series) containing the LC-10AT (VP series) pump, variable wavelength programmable UV/ VIS detector SPD-10AVP, and Rheodyne injector (7725i) with a 20 μL fixed loop. The chromatographic data acquisition was managed using Empower software version 2. For weighing and sample preparation, an analytical balance from Mettler Toledo was employed. The chromatographic separation was carried out using a Phenomenex Luna C18 column with dimensions of 250 cm×4.6 mm×5 μm.
Reagents and chemicals
All reagents and solvents used in the study were of high quality and met analytical and HPLC-grade standards. Acetonitrile, potassium dihydrogen orthophosphate, and orthophosphoric acid were procured from SD Fine-chem Ltd., Mumbai, India. To ensure the purity of the water used, high-quality deionized water was obtained through a process of double distillation and purification using the milli-Q water purification system. For filtration purposes, 0.45 μm nylon filters were employed, and these filters were purchased from Advanced Micro Device Pvt. Ltd., Chandigarh. The use of such high-grade reagents, solvents, and filters helps to ensure the accuracy and reliability of the HPLC analysis.
Buffer Preparation
To prepare the diluent, 2.72 g of potassium dihydrogen orthophosphate were dissolved in 100 mL of HPLC grade water. Orthophosphoric acid was employed to adjust the pH to 5.0. After adjusting the pH, the solution was filtered through a 0.45 μm nylon membrane filter. The filtered solution was then degassed to eliminate any dissolved gases. This prepared solution was used as the diluent for both the sample and standard solutions used in the HPLC analysis. By using this standardised diluent, any potential interference from impurities or contaminants in the solvent was minimised, ensuring accurate and reliable results during the chromatographic analysis.
Chromatographic conditions
The experiments were conducted using an isocratic elution method, where the mobile phase composition remained constant throughout the analysis. The binary mobile phase consisted of a mixture of potassium dihydrogen phosphate buffer (0.02 M) and acetonitrile in a volumetric ratio of 70:30. 0.1% orthophosphoric acid was used to achieve a pH of 4.0 for the mobile phase, and the resulting solution was filtered through a membrane filter to remove any particulate matter. Before running the samples, the mobile phase was degassed to remove dissolved gases that could interfere with the analysis. The flow rate of the mobile phase during the HPLC analysis was set at 1 mL/min. The column temperature was maintained at ambient conditions, specifically 27°C, during the chromatographic separation. For each run, a 20 μL volume of the sample was injected into the HPLC system, and the effluents from the column were detected using a UV detector at a wavelength of 250 nm (Figure 2). This specific wavelength was chosen to detect the Lobeglitazone based on its characteristic UV absorption. By employing these experimental conditions, the HPLC system could effectively separate and quantify Lobeglitazone in the sample, providing reliable and accurate results for analysis.
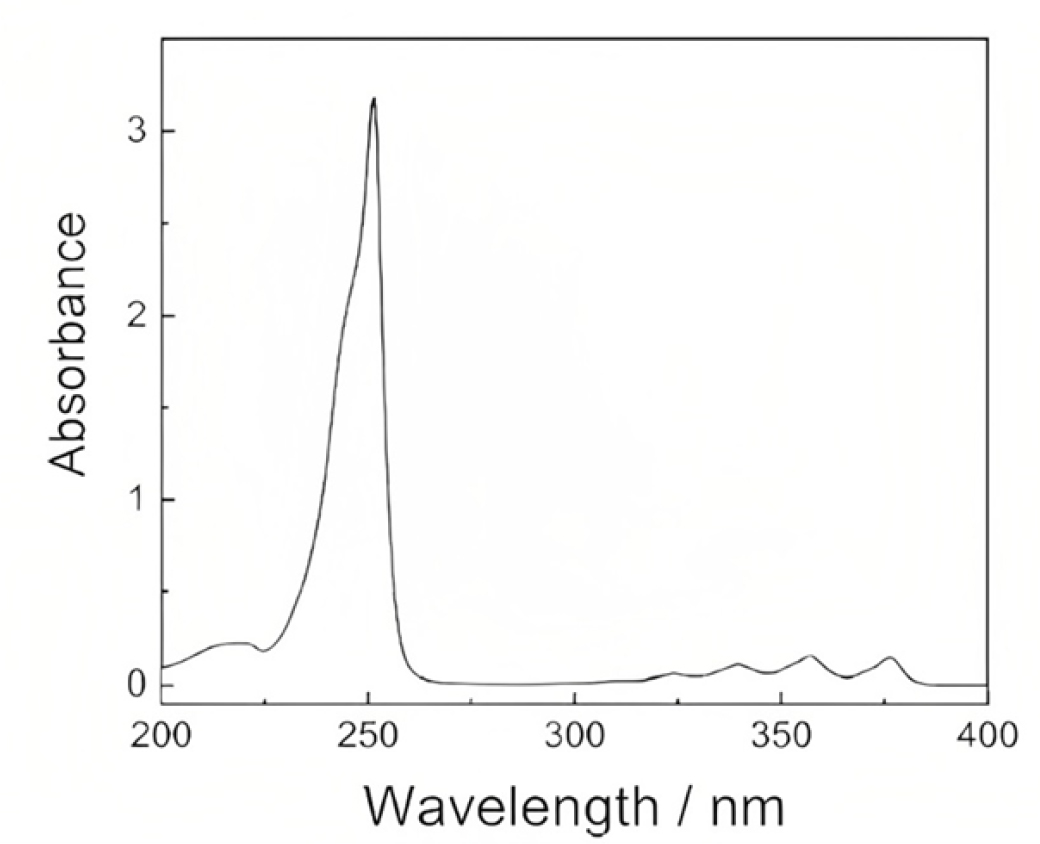
Figure 2.
UV spectra of Lobeglitazone.
Preparation of standard stock solution
An accurately weighed amount of 50 mg Lobeglitazone RS was taken in a 25 mL cleaned and dried volumetric flask. This was then diluted with 20 mL of diluent and sonicated. The volume was increased to 25 mL with the same solvent. This was marked and labelled as a stock solution (2 mg/mL). Further, 0.5 mL of Lobeglitazone was pippetted from the above stock solution into a 20 mL volumetric flask and diluted up to the mark with diluents to get 50 μg/mL of Lobeglitazone.
Preparation of sample solution
50 mg of the test sample was taken into a 25 mL volumetric flask. 20 mL of diluent was added and sonicated to dissolve. Diluent was added to make the volume 25 mL and was mixed well. Further, 0.5 mL of Lobeglitazone was pippetted from the above stock solution into a 20 mL volumetric flask and diluted up to the mark with diluents to get 50 μg/mL of Lobeglitazone.
RESULTS
Evaluation of system suitability
During the validation process, system suitability tests were performed to ensure that the HPLC system was performing reliably and consistently. For each validation parameter, six replicate injections of the standard solution with a concentration of 10 μg/mL were made. The system suitability parameters, including column efficiency, plate count, and tailing factor, were recorded for each injection. The results obtained from these injections were evaluated against predetermined acceptance criteria or limits. Based on the recorded data, the system suitability parameters were found to be within the specified limits, indicating that the HPLC system was functioning adequately and providing consistent results.
In particular, the percentage RSD (Relative Standard Deviation) of the six replicate injections of the standard solution was determined. The RSD is a measure of the precision or reproducibility of the HPLC system. The requirement was that the RSD percentage not exceed 2% to be considered acceptable. Since the RSD of the six injections of the standard solution was found to be within the specified limit (not more than 2%), it indicates that the system is precise and provides reliable results, which is essential for accurate quantification of Lobeglitazone in the samples. The results obtained were within the limit and are shown in Table 1.
| Sl. No. | Parameter | Lobeglitazone | Acceptance criteria |
|---|---|---|---|
| 1. | Retention Time (RT) | 2.157 | — |
| 2. | Theoretical plates (N) | 3176.816 | NLT 2000 |
| 3. | Tailing factor (T) | 0.868 | NMT 2.0 |
| 4. | Linearity range (μg/mL) | 10-60 | — |
| 5. | Detection Limit (μg/mL) | 0.8 | — |
| 6. | Quantification limit (μg/mL) | 2.5 | — |
| 7. | Regression data: Slope | 109.48 | — |
| 8. | Regression data: Intercept | 214.1 | — |
| 9. | Regression data: Correlation coefficient | 0.9996 | — |
System suitability parameters for Lobeglitazone.
Specificity and selectivity
The specificity of an analytical technique refers to its capability to measure or identify a specific substance in a sample without any interference from other compounds that may be present, and it should have the ability to differentiate and quantify the desired target substance in the presence of potential interfering substances. From the specificity study, it was observed that the chromatogram for the Lobeglitazone sample with the Lobeglitazone reference standard showed a positive response, while the blank (diluents) had no response or interference. Hence, the method was specific. The chromatograms of standard and blank injections are shown in Figures 3 and 4.
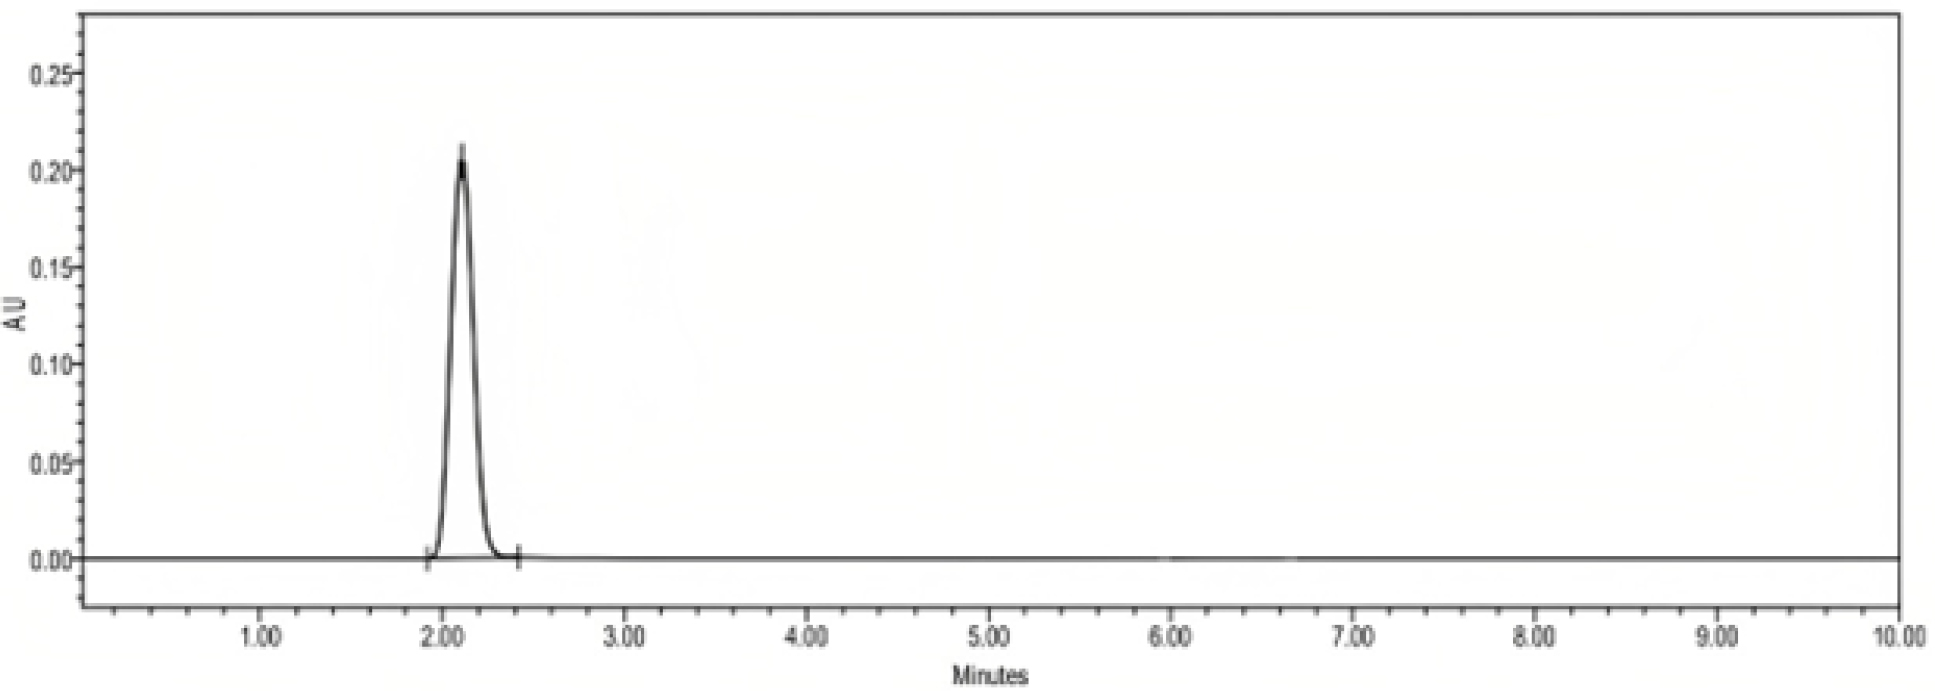
Figure 3.
Chromatogram for Standard.
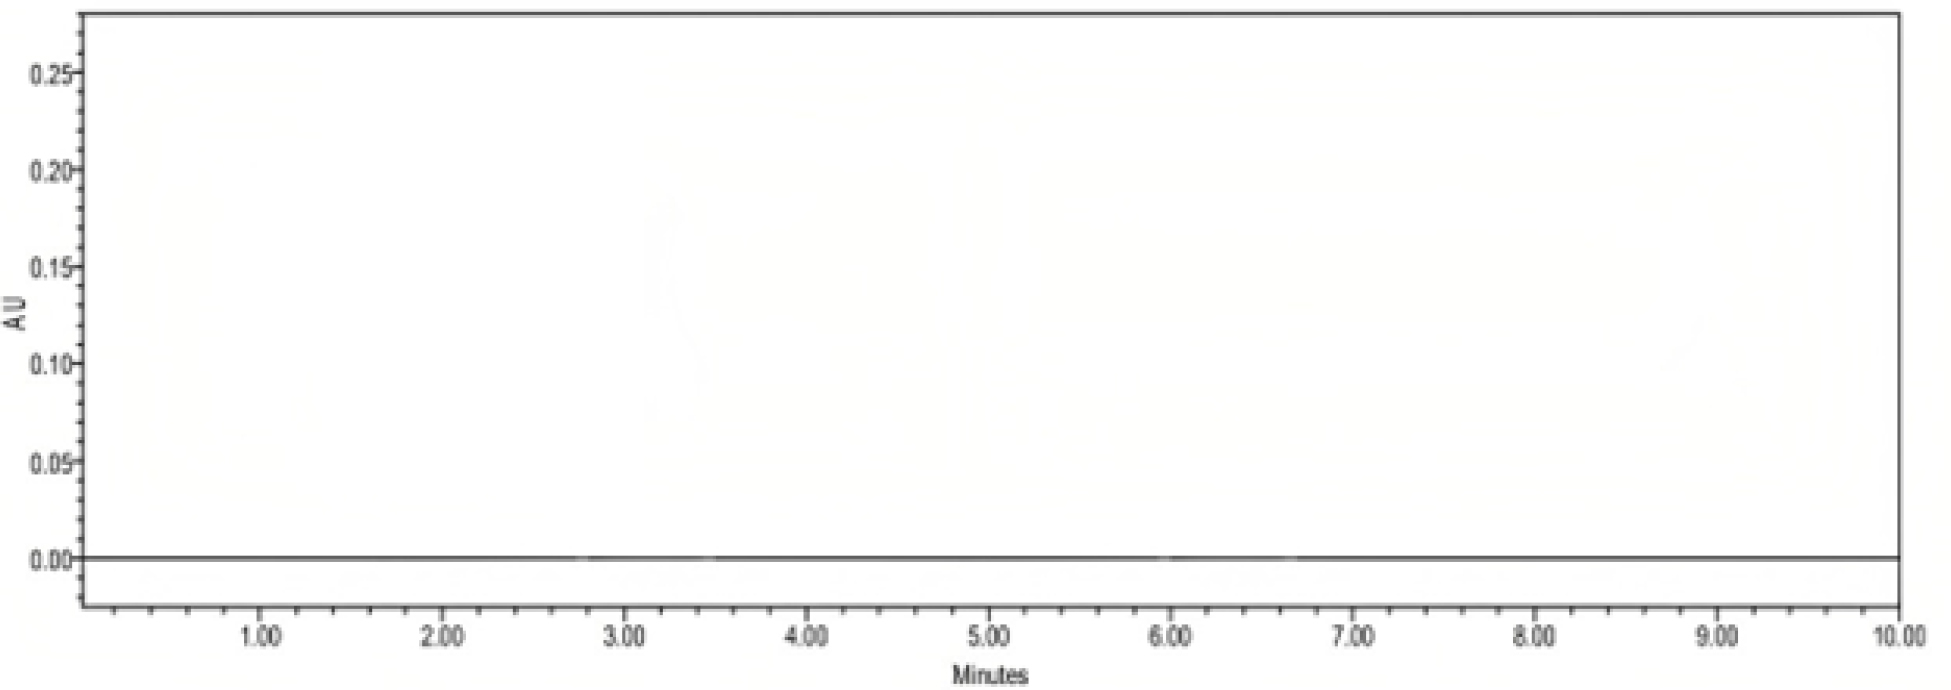
Figure 4.
Chromatogram for blank injection.
Linearity
To assess the linearity of the drug Lobeglitazone, a series of dilutions were prepared using the standard stock solution. The dilutions covered a concentration range of 10-60 μg/mL. For each concentration, the peak area response was measured during the HPLC analysis.
The linearity of Lobeglitazone graph was plotted by taking the concentration of the drug (in μg/mL) on the x-axis and the corresponding Area Under the Curve (AUC) on the y-axis. A linear relationship between the drug concentration and peak area response was observed in the tested range of 10-60 μg/mL. The obtained results are presented in Figure 5 and Table 2. This linearity is a crucial characteristic in analytical methods as it allows for accurate quantification of the drug at various concentrations based on the measured peak areas. The linear relationship between concentration and peak area response demonstrates the reliability of the HPLC method for analysing Lobeglitazone at different sample concentrations within the specified range.
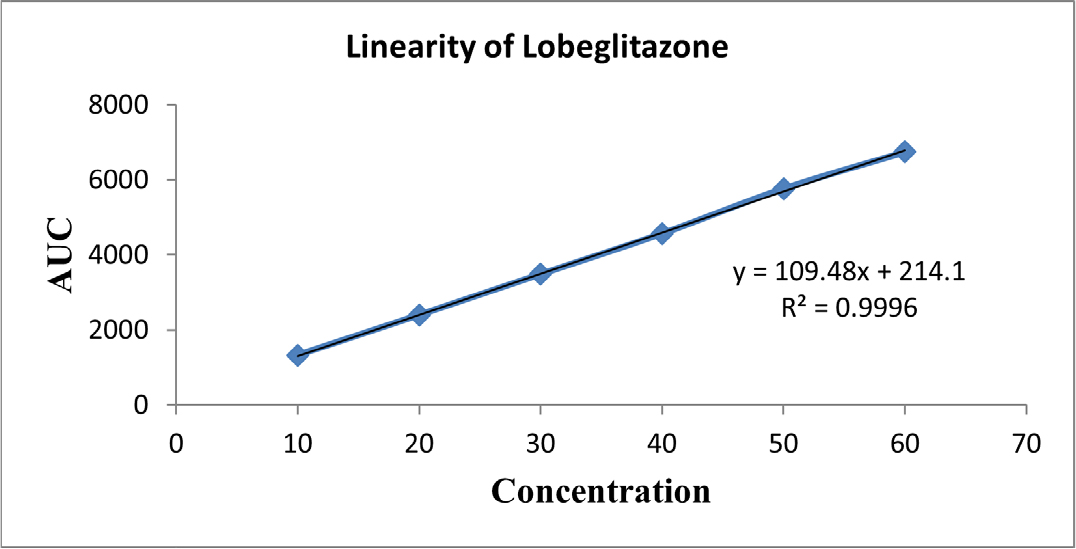
Figure 5.
Linearity graph of Lobeglitazone.
| Sl. No. | Drug | Values of X and Y variables | Correlation co-efficient | ||||||
|---|---|---|---|---|---|---|---|---|---|
| 1. | LOBGL | Variable | 1 | 2 | 3 | 4 | 5 | 6 | 0.999 |
| X | 10 | 20 | 30 | 40 | 50 | 60 | |||
| Y | 1320.919 | 2393.537 | 3483.155 | 4567.772 | 5766.389 | 6744.007 | |||
Linearity of Lobeglitazone.
Precision
The system precision was assessed to demonstrate the consistency and reproducibility of the HPLC method. For this purpose, the standard solution at the test concentration was prepared, and six repeated injections of this standard solution were made into the HPLC system. The percentage RSD (Relative Standard Deviation) was calculated to evaluate the repeatability of the standard preparation. The RSD for repeatability of standard preparation was found to be 0.335, which is very low. This indicates that the HPLC system is precise and provides consistent results for the standard solution injections.
Similarly, the repeatability of sample preparation was also evaluated by preparing the sample solution at the test concentration and making six repeated injections into the HPLC system. The percent RSD for repeatability of sample preparation was calculated to be 0.286, which is also very low. This demonstrates that the method is highly precise and consistent in analysing the samples. Overall, the method’s precision, which considers both the repeatability of standard preparation and sample preparation, was found to be satisfactory. The RSD for method precision was determined to be within the acceptable limit of 2.0%. These results, as presented in Table 3, confirm the reliability and reproducibility of the HPLC method for the analysis of Lobeglitazone, making it suitable for routine use in quantifying Lobeglitazone in various samples.
| Sl. No. | System Precision | Method Precision | ||
|---|---|---|---|---|
| Rt | AUC | Rt | AUC | |
| 1. | 2.157 | 5643.784 | 2.153 | 5662.378 |
| 2. | 2.153 | 5635.277 | 2.156 | 5623.336 |
| 3. | 2.150 | 5607 | 2.151 | 5644.469 |
| 4. | 2.159 | 5613.915 | 2.154 | 5633.439 |
| 5. | 2.147 | 5599.53 | 2.150 | 5653.811 |
| Mean | 2.154 | 5619.901 | 0.2387 | 5643 |
| SD | 0.00491 | 18.868 | 0.002 | 15.58 |
| % RSD | 0.228 | 0.335 | 0.111 | 0.286 |
Precision study.
Intermediate precision
The intermediate precision evaluation, the standard solution, was analysed by two different analysts, each using a separate HPLC instrument in different laboratories. The analysis was carried out on different days to introduce variability due to time differences. The % RSD was calculated for each set of conditions to determine the intermediate precision of the method. Assay results by two different analysts on different days have been found to be very close to each other, with a difference of only 0.665%, and the RSD of the two analysts was less than 2.0%, which is within the acceptable limit.
This result indicates that the HPLC method is robust and shows consistent performance across different laboratories, instruments, and analysts, even when the analysis is conducted on different days. The method’s intermediate precision demonstrates its suitability for routine use and ensures that accurate and reliable results can be obtained consistently, regardless of the specific experimental conditions. The data showing the percentage RSD values for intermediate precision are presented in Table 4.
| Analyst Name | Analyst I | Analyst II | ||||
|---|---|---|---|---|---|---|
| Area of Std. | 5687 | 5712 | ||||
| Sl. No. | Concentration (μg/ mL) | AUC | Assay (%) | Concentration | AUC | Assay (%) |
| 1. | 50 | 5671.8 | 99.732 | 50 | 5642.3 | 99.129 |
| 2. | 50 | 5632.2 | 99.036 | 50 | 5623.6 | 98.452 |
| 3. | 50 | 5615.9 | 98.749 | 50 | 5649.9 | 99.087 |
| 4. | 50 | 5691.1 | 100.072 | 50 | 5653.8 | 98.981 |
| 5. | 50 | 5623.4 | 98.881 | 50 | 5686.1 | 99.546 |
| Mean | 5647 | 99 | Mean | 5651 | 99 | |
| SD | 32.80 | 0.58 | SD | 22.73 | 0.39 | |
| % RSD | 0.581 | 0.581 | % RSD | 0.402 | 0.396 | |
| Difference between mean assay of two different analysts = 0.665 % | ||||||
Intermediated precision or Ruggedness study.
Accuracy or recovery studies
To assess the accuracy of the HPLC method, recovery studies were conducted in triplicate. The recovery studies involved injecting different concentrations of the pure drug (Lobeglitazone) into the pre-analysed samples at three different levels: 80%, 100%, and 120%. The mean recovery percentage was then calculated based on the results obtained from the recovery studies. The mean recovery percentage obtained was 100.43% for the assay. This indicates that the HPLC method is accurate in quantifying the Lobeglitazone content in the samples and provides results that agree with the expected values within the acceptable range. The data from the recovery studies, including the spiked concentrations and the corresponding mean recovery percentages, are presented in Table 5. The accuracy of the method is confirmed by the successful recovery of Lobeglitazone from the pre-analysed samples at various spiked levels, demonstrating its reliability for quantitative analysis in real samples.
| Sl. No. | Level | Amount added (μg/mL) | Mean (n=5) | % Recovery |
|---|---|---|---|---|
| 1. | 80% | 50 | 4612 | 101.31 |
| 2. | 100% | 50 | 5678 | 99.78 |
| 3. | 120% | 50 | 6842.4 | 100.21 |
Accuracy study.
Limit of Detection (LOD)
LOD is a measure of the lowest concentration of a sample that can be reliably detected but is not necessarily quantified under the stated experimental conditions. The LOD was calculated using the formula LOD=3.3*(N/S), where N is the standard deviation of the peak area and S is the slope of the calibration curve. The results are shown in Table 3.
Limit of Quantification (LOQ)
LOQ is the lowest concentration of an analyte that can be reliably quantified with acceptable accuracy and precision. The LOQ was calculated using the formula LOQ=10*(N/S), where N is the standard deviation of peak area (N) and the slope (S) of the calibration curve. The results are shown in Table 3.
Robustness
To evaluate the robustness of the HPLC method, deliberate changes were made to some operating conditions, specifically the flow rate and wavelength used during the analysis. After applying these variations to the analytical conditions, it was observed that there were no significant changes in the chromatogram, tailing factor, or plate counts. This indicates that the method is robust and can tolerate variations in the flow rate and wavelength without compromising the accuracy and precision of the results. The lack of remarkable changes in the chromatogram and other parameters demonstrates the method’s ability to produce consistent and reliable results even when subjected to slight deviations in the analytical conditions. The results from the robustness studies, including the specific variations tested and their corresponding impact on the method’s performance, are presented in Table 6. Overall, the robustness of the HPLC method is established, confirming its suitability for routine use and its ability to provide consistent and reliable results under slightly different operating conditions.
| Parameters | Mean Peak area | SD | %RSD | Tailing factor |
|---|---|---|---|---|
| Wavelength minus (248 nm) | 5792.034 | 8.321 | 0.143 | 1.13 |
| Wavelength plus (252 nm) | 5825.201 | 57.595 | 0.988 | 1.125 |
| Flow rate minus (0.8 min/mL) | 5807.3 | 1.56 | 0.027 | 1.108 |
| Flow rate plus (1.2 min/mL) | 5799.274 | 8.25 | 0.142 | 1.142 |
| Organic phase ratio change (less) | 5959.962 | 17.503 | 0.293 | 1.147 |
| Organic phase ratio change (more) | 6011.438 | 58.295 | 0.969 | 1.159 |
| Column change | 5482.605 | 85.503 | 1.559 | 1.168 |
| Temperature minus | 5956.636 | 13.753 | 0.230 | 1.177 |
| Temperature plus | 5462.633 | 35.533 | 0.650 | 1.163 |
Robustness study.
Analysis of marketed formulation
To determine the content of Lobeglitazone in LOBG tablets, 20 tablets, each containing 0.5 mg of Lobeglitazone, were selected. These tablets were accurately weighed, and their weights were averaged. The tablets were then finely powdered to ensure homogeneity. A quantity of the powdered tablet equivalent to the weight of one tablet was measured and transferred into a 10 mL volumetric flask. To this flask, 7 mL of methanol was added. The flask was subjected to sonication for 10 min to ensure the complete dissolution of the Lobeglitazone from the powdered tablet into the solution. The solution was then filtered through a 0.45 μm nylon filter. The obtained filtrate was made up to volume with the same diluent in the 10 mL volumetric flask, resulting in a final concentration of 50 μg/mL.
A 20 μL volume of sample solution was injected into HPLC six times under the same experimental conditions described above. The peak areas were measured at 250 nm. The concentrations in the samples were determined using multilevel calibration developed on the same HPLC system under the same conditions using a linear regression equation. The results are presented in Table 7.
| Commercial formulation (Tablet) | Ingredients | Labeled amount (mg) | Amount found (mg) n = 6 | Found % |
|---|---|---|---|---|
| LOBG | Lobeglitazone | 0.5 | 0.495 | 99 |
Analysis of marketed formulation.
DISCUSSION
During the method development process for the determination of Lobeglitazone using HPLC, several chromatographic parameters were optimised to achieve specific criteria. The goal was to establish an HPLC method with a short analysis time (<5 min) and acceptable resolution (Rs>2). During the different trials, various mobile phases were employed, such as water:methanol (65:35 V/V), buffer:methanol (30:70 V/V), and phosphate buffer:acetonitrile (70:30 V/V), in different ratios.
Among the tested mobile phase compositions, the combination of phosphate buffer pH 4.0 and acetonitrile provided the most favourable results. It resulted in symmetrical peak shapes and good resolution for Lobeglitazone. The optimum wavelength for detection was determined to be 250 nm, which is the wavelength at which Lobeglitazone exhibits a significant UV absorption signal.
As a result of the method optimisation, the retention time for Lobeglitazone was found to be 2.15 min, which ensures that the compound is well separated and detected within a reasonable time frame. Overall, by carefully selecting the mobile phase composition, using the appropriate wavelength, and optimising other parameters, the developed HPLC method for Lobeglitazone analysis meets the desired criteria of short analysis time and acceptable resolution, making it suitable for routine analysis of Lobeglitazone samples. In this method a linear calibration curve was obtained within the concentration range of 10-60 μg/mL.
The LOD was calculated using the standard deviation of the Y-intercept of the regression line, and it was found to be 0.8 μg/mL. The LOQ was also derived from the regression line and was found to be 2.5 μg/mL. The LOD represents the lowest concentration of Lobeglitazone that can be reliably detected, while the LOQ is the lowest concentration that can be accurately quantified with acceptable precision.
The precision of the method was assessed, and the RSD (Relative Standard Deviation) values were found to be less than 2.0% for both the method precision and instrument precision. This indicates that the HPLC method is precise and provides consistent and reliable results with minimal variability. The accuracy of the method was considered satisfactory because the mean recovery percentage fell within an acceptable range (usually 99.78-101.31% for Lobeglitazone). Overall, the developed method demonstrated good accuracy, precision, and sensitivity, making it suitable for reliable quantification of Lobeglitazone in various samples within the specified concentration range.
Moreover, the method’s robustness was validated through deliberate modifications of several chromatographic parameters, such as flow rate, wavelength, temperature, and composition of the mobile phase. Despite these changes, there were no significant alterations in peak areas or retention times, indicating the method’s ability to provide consistent and reliable results under different conditions.
In comparison to a previously reported bioanalytical method, the developed HPLC method was found to be superior in several aspects. It exhibited a shorter retention time, a higher theoretical plate count (which signifies better resolution), and a mobile phase composition that facilitated good separation of Lobeglitazone from other components. These improvements enhance the efficiency and accuracy of the analysis, making the developed method more desirable for routine quantification of Lobeglitazone in various samples.
CONCLUSION
The HPLC method was successfully developed and validated on a Shimadzu HPLC model (VP series) for the determination of Lobeglitazone. The developed method is novel for the determination of drugs at a single wavelength, 20 μL injection volume, and Phenomenex Luna C18 (5 μm, 4.6*150mm) column. The method developed for Lobeglitazone was found to be simple, precise, sensitive, rapid, robust, and economical, which compiles the ICH guidelines. The analytical conditions developed with good resolution within a short analysis time. The %RSD for all parameters was found to be within the limit (less than 2%). Which indicates the method developed is suitable for the determination of Lobeglitazone in laboratories and for quality control purposes.
Cite this article:
Sai KEK, Srinivas M, Kumari BU, Sumalatha C, Madhavi A. Development and Validation of an HPLC Method for the Determination of Lobeglitazone in Bulk and in Tablet Formulation. Int. J. Pharm. Investigation. 2024;14(1):204-11.
ACKNOWLEDGEMENT
The authors would like to Thank Teja Educational Society, Hyderabad for providing facilities to carry out this work.
ABBREVIATIONS
| RP-HPLC | Reverse phase high-performance liquid chromatography |
|---|---|
| LOD | Limit of detection |
| LOQ | Limit of quantification |
| ICH | International Conference on Harmonization |
| UV | Ultraviolet detector |
| RSD | Relative standard deviation |
| RS | Related substances |
References
- Kahn SE. The relative contributions of insulin resistance and beta-cell dysfunction to the pathophysiology of type 2 diabetes. Diabetologia. 2003;46(1):3-19. [PubMed] | [CrossRef] | [Google Scholar]

- Lebovitz HE. Thiazolidinediones: the forgotten diabetes medi-cations. Curr Diab Rep. 2019;19(12):151 [PubMed] | [CrossRef] | [Google Scholar]

- Lehmann JM, Moore LB, Smith-Oliver TA, Wilkison WO, Willson TM, Kliewer SA, et al. An antidiabetic thiazolidinedione is a high affinity ligand for peroxisome proliferator-activated re-ceptor gamma (PPAR gamma). J Biol Chem. 1995;270(22):12953-6. [PubMed] | [CrossRef] | [Google Scholar]

- Kohlroser J, Mathai J, Reichheld J, Banner BF, Bonkovsky HL. Hepatotoxicity due to troglitazone: report of two cases and re-view of adverse events reported to the United States Food and Drug Administration. Am J Gastroenterol. 2000;95(1):272-6. [PubMed] | [CrossRef] | [Google Scholar]

- Bae J, Park T, Kim H, Lee M, Cha BS. Lobeglitazone: A Novel thiazolidinedione for the management of type 2 diabetes mellitus. Diabetes Metab J. 2021;45(3):326-36. [PubMed] | [CrossRef] | [Google Scholar]

- Kim SG, Kim DM, Woo JT, Jang HC, Chung CH, Ko KS, et al. Efficacy and safety of lobeglitazone monotherapy in patients with type 2 diabetes mellitus over 24-weeks: a multicenter, randomized, double-blind, parallel-group, placebo-controlled trial. PLOS ONE. 2014;9(4) [PubMed] | [CrossRef] | [Google Scholar]

- Yoo J, Jeon J, Baik M, Kim J. Lobeglitazone, a novel thiazolidinedione, for secondary prevention in patients with ischemic stroke: a nationwide nested case-control study. Cardiovasc Diabetol. 2023;22(1):106 [PubMed] | [CrossRef] | [Google Scholar]

- Bae J, Park T, Kim H, Lee M, Cha BS. Lobeglitazone: A novel thiazolidinedione for the management of type 2 diabetes mellitus. Diabetes Metab J. 2021;45(3):326-36. [PubMed] | [CrossRef] | [Google Scholar]

- Lee JH, Woo YA, Hwang IC, Kim CY, Kim DD, Shim CK, et al. Quantification of CKD-501, lobeglitazone, in rat plasma using a liquid-chromatography/tandem mass spectrometry method and its applications to pharmacokinetic studies. J Pharm Biomed Anal. 2009;50(5):872-7. [PubMed] | [CrossRef] | [Google Scholar]

- Piyusha DG, Shailesh GJ. Bioanalytical method development and validation for determination of lobeglitazone in human plasma. Int Res J Modernization Eng Technol Sci. 2023;5(05):8103-16. [PubMed] | [CrossRef] | [Google Scholar]

- International Conference on Harmonization (ICH). Federal Register, step 4 version. 2005;Q2A [cited 1/6/2023]. Available from: https://www.ich.org/page/quality-guidelines
Draft revised Guidance on Validation of Analytical Procedure: Text and Methodology.

