ABSTRACT
Background
The solubility of medications significantly affects their absorption and therapeutic effectiveness. Drugs with poor solubility often faces challenges in formulation development leading to low bioavailability and fluctuations in blood concentration. Olanzapine, an atypical antipsychotic drug used in treating schizophrenia, exemplifies this issue with its low water solubility and subsequent low bioavailability.
Materials and Methods
This study explores the enhancement of olanzapine’s solubility through the use of various carriers, including urea, polyethylene glycol 4000, polyvinyl pyrrolidone K-30 and carboxy methyl cellulose. Method: Response surface methodology using 24 optimization technique was employed to evaluate the solubility enhancement potential and optimize the formulation parameters. Regression equations and contour plots were utilized to elucidate the relationship between carriers, carrier ratios and solubility-related parameters such as dissociation constant, complexation efficiency, Gibbs free energy and solubility.
Results and Conclusion
The findings show that polyvinyl pyrrolidone K-30 has a positive impact on solubility-related parameters as its concentration rises. Polyvinyl pyrrolidone K-30 surmounts other carriers for making potent Olanzapine formulations.
INTRODUCTION
An essential physicochemical component influencing medication absorption and therapeutic efficacy is solubility. Inadequate solubility in water causes formulation development to fail. Drugs that are poorly soluble in water and that dissolve slowly in aqueous gastrointestinal tract fluid frequently have inadequate bioavailability for which dose has to be increased causing fluctuations in blood concentration (Venkateskumar Krishnamoorthyet al., 2011). Poor aqueous solubility is found in about 35 to 40% of medications. One of the biggest challenges faced by formulation scientists in the pharmaceutical sector is creating oral dose forms of poorly soluble medications. Enhancing the drug’s solubility can be accomplished by expanding its surface area that is accessible to dissolution medium (Kulkarni Ajit Shankarraoet al., 2010).
Olanzapine belongs to the class of thienobenzodiazepine. This medication is an atypical antipsychotic that is used to treat schizophrenia. Its oral bioavailability is only 60% making it nearly insoluble in water since it has extensive first pass metabolism (Priyanka Kolliet al., 2023). To avoid taking an atypical antipsychotic tablet on a regular basis some patients with schizophrenia hold back the tablet under their tongue. Furthermore, schizophrenic patients with dysphagia are unable to swallow traditional olanzapine tablet (Mudit Dixitet al., 2014).
Olanzapine is poorly soluble in water and falls under Class II of Biopharmaceutics Classification System. Olanzapine features high permeability and low solubility that are 93% bound to plasma protein. Olanzapine has a relatively low oral bioavailability due to its significant pre systemic metabolism in the liver (Mudit Dixitet al., 2011).
One of the best methods to assess a drug’s water solubility is phase solubility studies. A substance’s purity and the affinity between substances can both be inferred from phase solubility study results. Two categories of inclusion complexes can occur, according to phase solubility study results. Category A includes formation of soluble inclusion complex. Category B includes low water solubility inclusion complex (Avinash Ramrao Tekadeet al., 2020). Studies on phase solubility can also reveal information regarding how molecular size and concentration affect medicinal molecules solubility. Drugs that are poorly soluble in water have two main problems. They frequently dissolve extremely slowly that induce slow rate of dissolution and absorption that eventually causes low bioavailability (Ladan Akbarpour Nikghalb, 2012).
The need for the current study is to improve the solubility of Olanzapine to amend dosing regimen and increase patient compliance leading more tailored therapeutic options. The current research work includes novel insights into physicochemical properties of Olanzapine when combined with various carriers. This study aims to identify novel formulation which has not been extensively explored by analysing and comparing effects of different carriers.
MATERIALS AND METHODS
Materials
Olanzapine was received as a gift sample from Micro Labs (Bangalore, India). Urea and polyethylene glycol 4000 was purchased from Yarrow Chem Products, (Mumbai, India). Carboxy methylcellulose and polyvinyl pyyrolidone K-30 from were purchased from SD Fine Chemicals Ltd., (Mumbai, India). All other solvents and reagents used were of analytical grade.
Methodology
Phase solubility analyses were conducted in triplicate following stoichiometric proportions. Phase solubility analysis were carried out by adding drug and increasing amount of carriers (urea, polyethylene glycol 4000, polyvinyl pyrrolidone K-30, Carboxy methyl cellulose) as per the specified ratios in screw-capped bottles and shaken in a Rotary flask shaker and incubated at 37ºC for 48 hr. After 48 hr, the solutions were filtered using Whatman filter paper. The filtrate was diluted and analyzed spectrophotometrically at 250 nm. The solubility of Olanzapine in various carriers was calculated using the standard curve. The data were used in phase solubility analysis to calculate stability constant, complexation efficiency and thermodynamic parameter ∆G. The blanks were prepared using the same concentration of carrier in distilled water so as to cancel out any absorbance that may be exhibited by carrier (Mayara et al., 2008).
Phase Solubility Analysis
Stability constant
The stability constant was determined from the slope of linear portion the curves and intrinsic solubility of olanzapine in an aqueous solution using equation 9 (Phennapha Saokhamet al., 2018).
Gibbs Energy (∆G)
Enthalpy
The Van’t Hoff equation was used to calculate the system’s enthalpy change (Mahmoud et al., 2007).
R is the Universal Gas Constant (8.313 J/Mol K), Ka is the stability constant, dT the differences in temperature (Kelvin).
Entropy
Equation was used to determine the system’s entropy (Mahmoud et al., 2007).
where ∆H is the enthalpy and ∆G the entropy.
Fourier transform infra-red spectroscopic studies
FT-IR Spectra of pure olanzapine, carriers [urea, polyethylene glycol 4000, polyvinyl pyrollidone K-30, carboxy methyl cellulose] A FT-IR Spectrophotometer equipped with a KBr disc was used to measure the physical mixture of the medication and carrier (1:1). Spectra of dried mixture of olanzapine, urea, polyethylene glycol 4000, polyvinyl pyyrolidone K-30, Carboxy methyl cellulose, with potassium bromide were measured after a baseline correction using dried potassium bromide. Individual components were bled in a glass pestle and mortar to physical combination (Priyanka Kolliet al., 2023).
Experimental Study Design for Optimization
Response surface methodology is a tool to analyse the impact of independent variables on dependent variables with the collection of statistical and mathematical techniques. The 24 factorial design was espoused to optimize the responses and to find out optimum process parameters with 2 variables at 4 levels. The carriers (X1) PEG 4000, CMC, PVP K 30 and urea and carrier ratio 1:1, 1:2, 1:3, 1:4 (X2) were considered as independent variables in the phase solubility method (Table 1). Each variable were studied at four levels as given the Table 1. The dependent variables selected were Ka (Y1), complexation efficiency (Y2), ΔG (Y3) and solubility (Y4) as in Table 2. Minitab® Statistical Software (Version 17.1) was used to perform the statistical analysis of values in Table 3. The high solubilizing carrier was chosen for further study (Preethi Gopalpura Bellaiahet al., 2022).
| Code | Independent Variables | Level (-1) | Level (0) | Level (+1) | Level (+2) |
|---|---|---|---|---|---|
| X1 | Carriers | CMC | Urea | PEG 4000 | PVP K 30 |
| X2 | Carrier ratio | 1:1 | 1:2 | 1:3 | 1:4 |
| Code | Dependent Variables |
|---|---|
| Y1 | Ka |
| Y2 | Complexation Efficiency |
| Y3 | ΔG |
| Y4 | Solubility |
| Sl. No. | Carrier | Slope | Intercept | Ka | CE | ΔG (kJ/mol) | Solubility of 1:4 (µg/mL) |
|---|---|---|---|---|---|---|---|
| 1 | PEG 4000 | 2270 | -87.18 | 0.01148 | -1.0004 | -152.8 | 13.81 |
| 2 | CMC | 5363 | -207.5 | 0.00482 | -1.0002 | -182.47 | 7.56 |
| 3 | PVP K30 | 1738 | -69.59 | 0.01438 | -1.0006 | -145.09 | 31.26 |
| 4 | Urea | 2501 | -99.78 | 0.01003 | -1.0004 | -157.42 | 11.7 |
RESULTS
For obtaining standard calibration curve for Olanzapine, 100 mg of Olanzapine was dissolved in 100 mL of solvent to make the main stock solution. From this main stock solution, series of dilutions were made from 2 µg/mL to 16 µg/mL and were analyzed by UV spectrophotometer at 250 nm. The R2 value is found to be 0.9998 and a linear line was obtained (Figure 1). This is used to calculate the concentration of olanzapine in phase solubility studies.
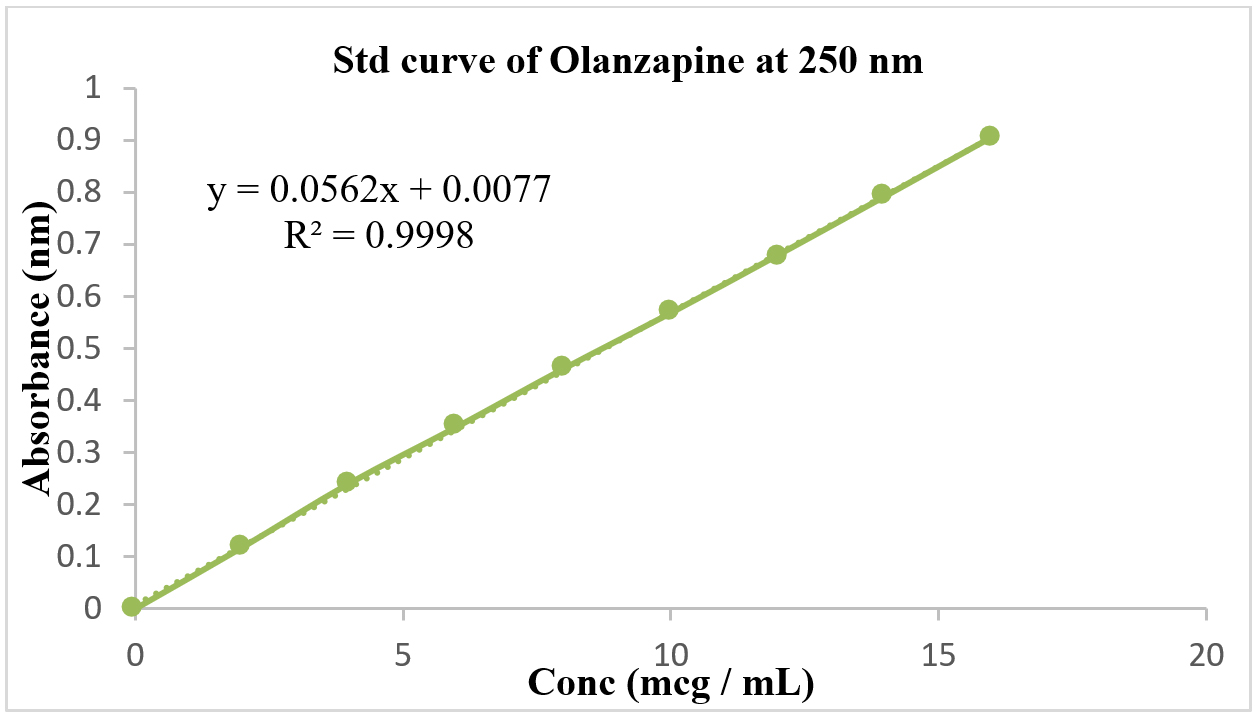
Figure 1:
Standard Curve of Olanzapine.
The FT-IR spectral analysis showed that there was no appearance or disappearance of any characteristic peaks of pure drug Olanzapine in the physical mixture of drug and excipients which confirms the absence of chemical interaction between drug and other excipients (Figures 2 and 3).
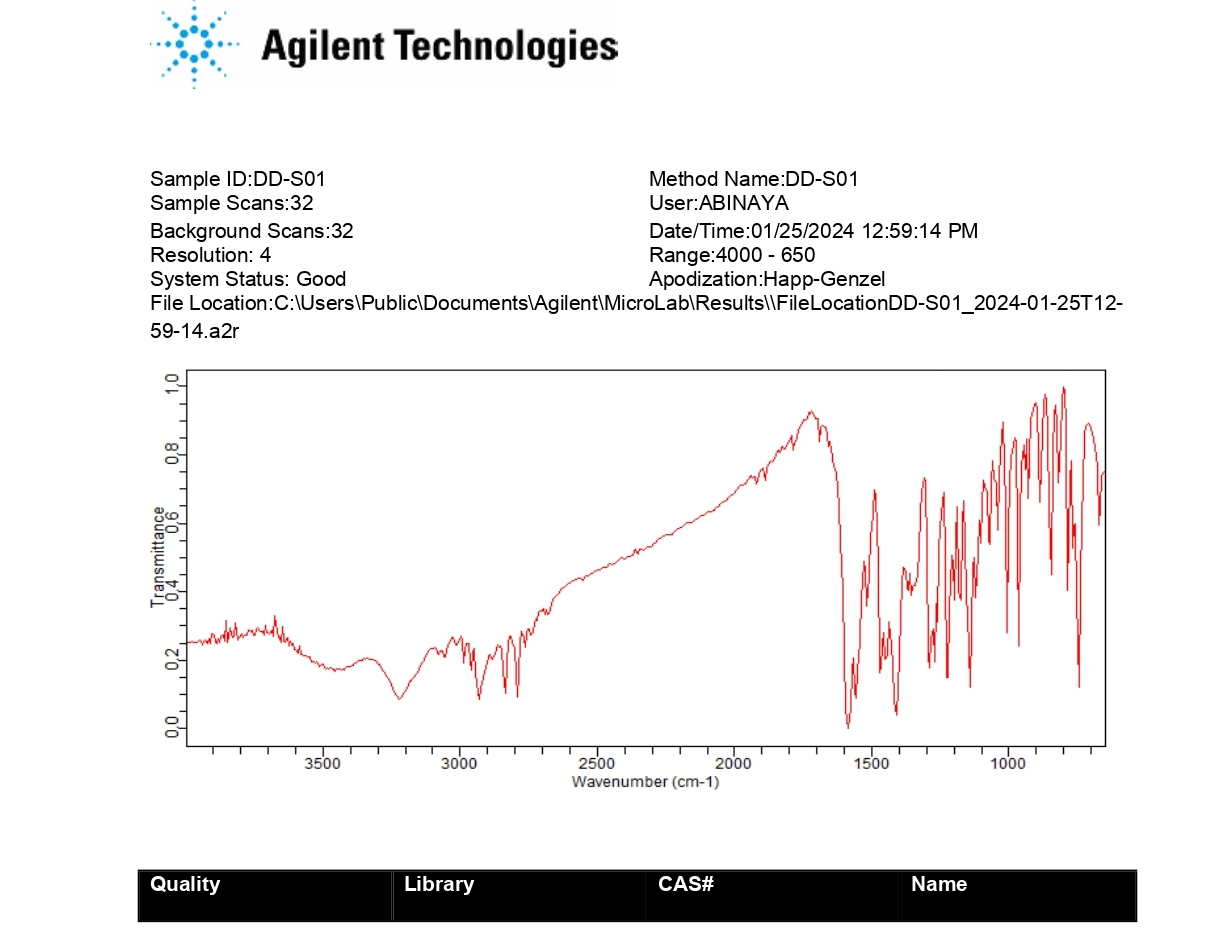
Figure 2:
FT-IR of pure drug Olanzapine.
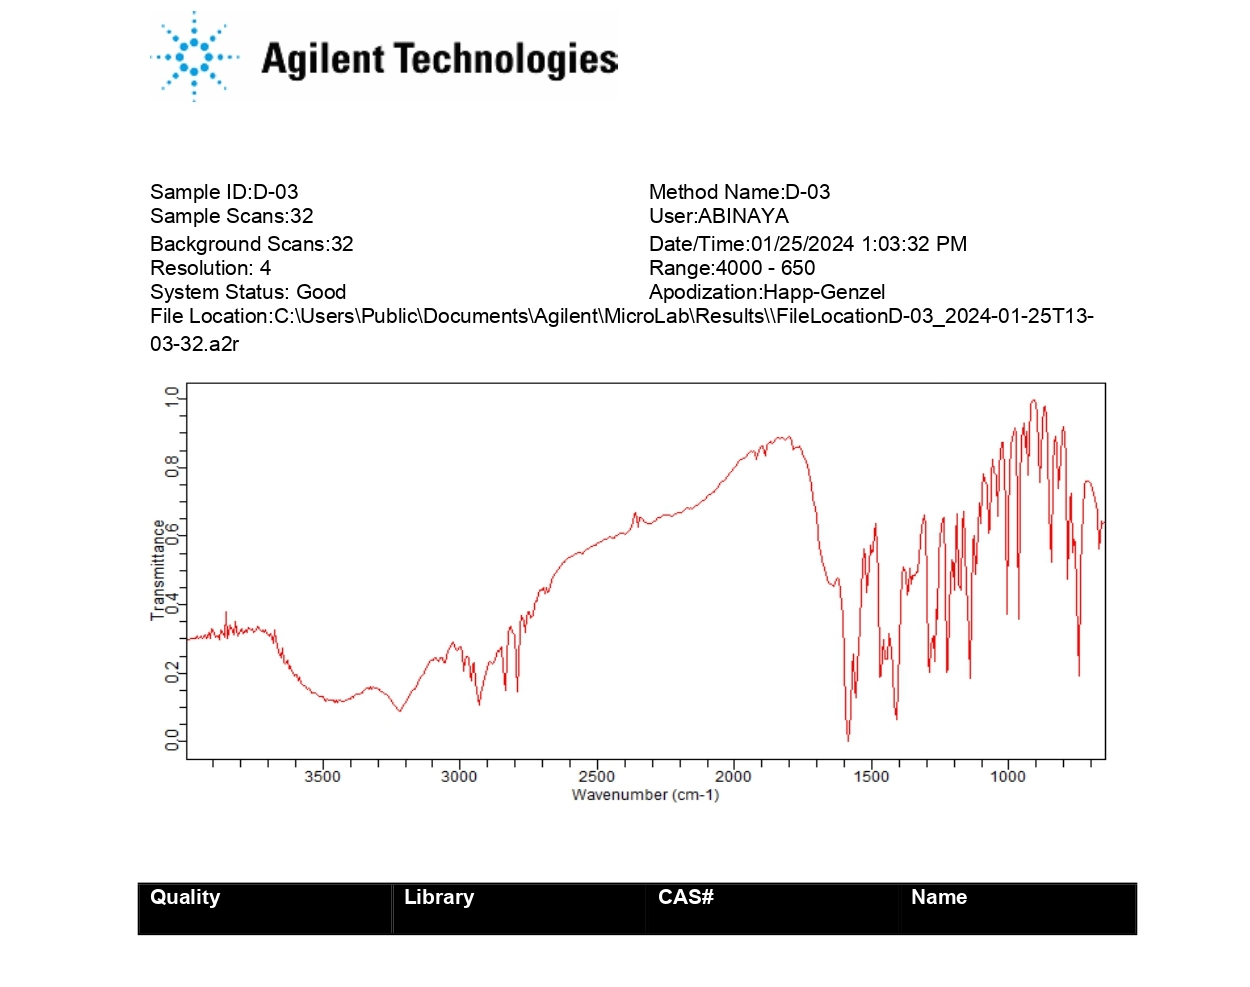
Figure 3:
FT-IR of Olanzapine+PVP K30.
Phase solubility studies shows that Ka values range from 0.00482 from 0.01438 (Figure 4 and Table 3), complexation efficiency ranges from -1.0002 to -1.0006 (Figure 5 and Table 3), ΔG ranges from -145.09 kJ/mol to -182.47 kJ/mol (Figure 6 and Table 3) and solubility of the drug ranges from 7.56 to 31.26 µg/mL (Figure 7 and Table 3).
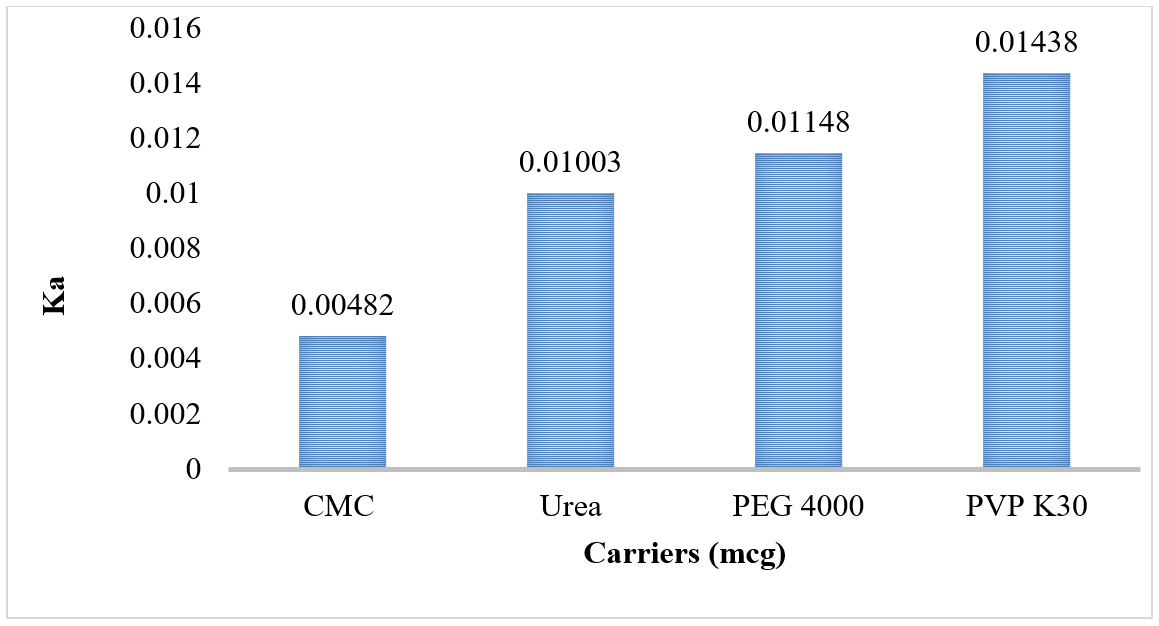
Figure 4:
Histogram of Carriers vs Ka.
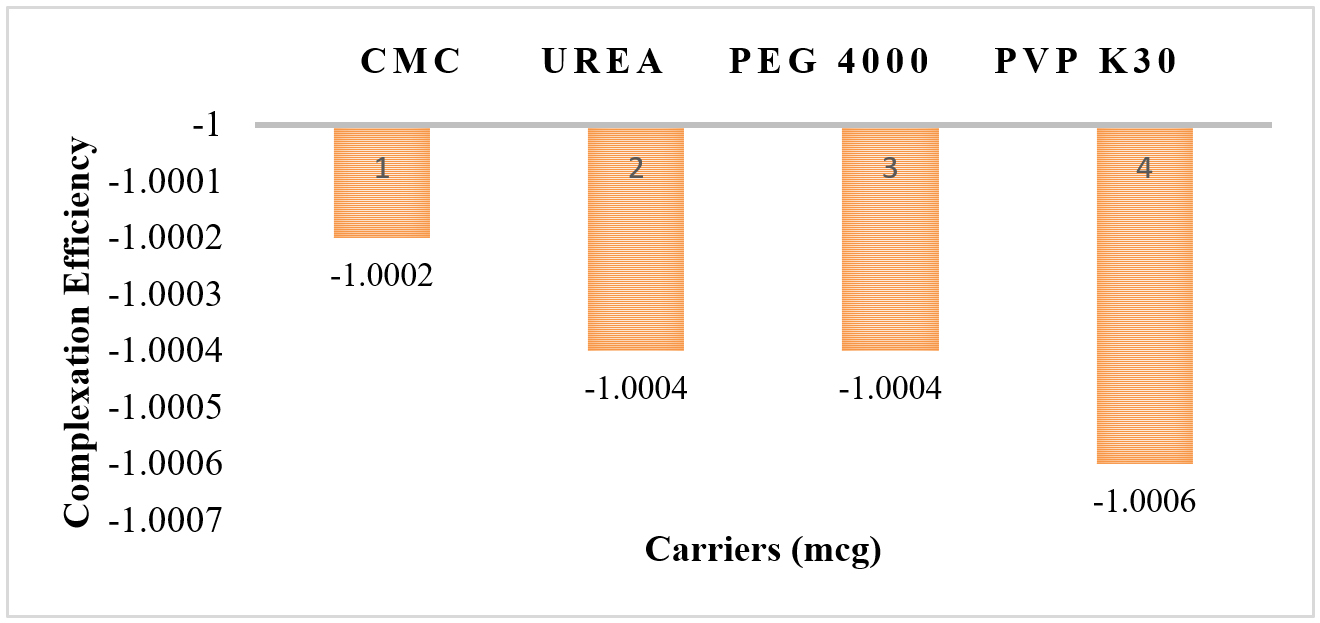
Figure 5:
Histogram of Carriers vs Complexation Efficiency.
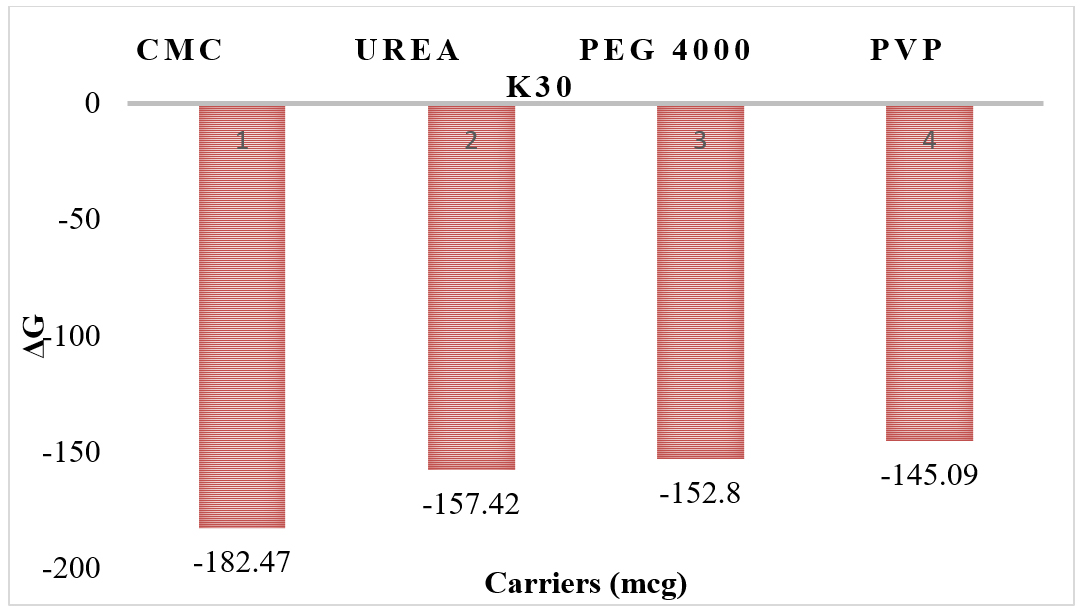
Figure 6:
Histogram of Carriers vs ΔG.
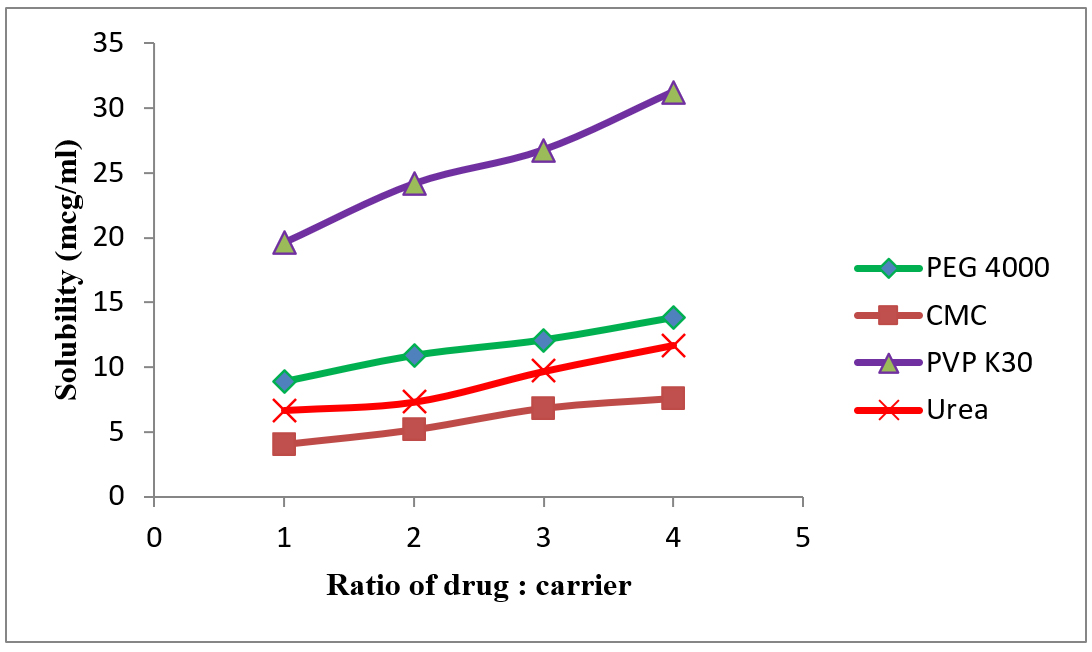
Figure 7:
Phase Solubility Curves.
Regression equations
Y1-Ka=-0.0375+0.000753 X1 Carriers+0.03053 X2 Carrier ratio
- X1 (Carriers): This is the first independent variable, representing the amount of carriers. The coefficient is 0.000753, suggesting that for each unit increase in the amount of carriers (X1), the difference between Y1 and Ka increases by 0.000753 units (Figure 8). This implies that increasing the amount of carriers leads to a slight increase in the difference between Y1 and Ka.
- X2 (Carrier ratio): This is the second independent variable, representing the carrier ratio. The coefficient is 0.03053, suggesting that for each unit increase in the carrier ratio (X2), the difference between Y1 and Ka increases by 0.03053 units. This implies that increasing the ratio of carriers to solute leads to a more substantial increase in the difference between Y1 and Ka.
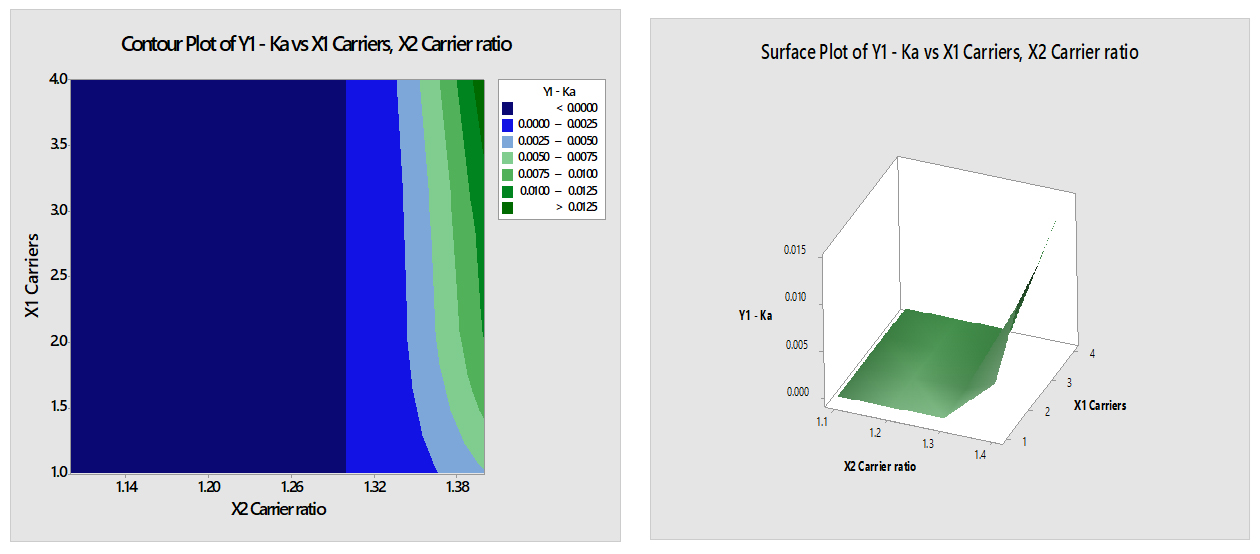
Figure 8:
Contour & Surface plot of Y1 (Ka) Vs X1 (Carriers) & X2 (Carrier ratio).
Y2-CE=3.501-0.0000 X1 Carriers-3.001 X2 Carrier ratio
- X1 (Carriers): This is the first independent variable, representing the amount of carriers. However, the coefficient is zero (0.0000), which means that changes in X1 do not contribute to changes in Y2-CE. In other words, the amount of carriers does not affect the difference between Y2 and CE.
- X2 (Carrier ratio): This is the second independent variable, representing the carrier ratio. The coefficient is -3.001, suggesting that for each unit increase in the carrier ratio (X2), the difference between Y2 and CE decreases by 3.001 units (Figure 9). This implies that increasing the ratio of carriers to solute leads to a decrease in the difference between Y2 and CE.
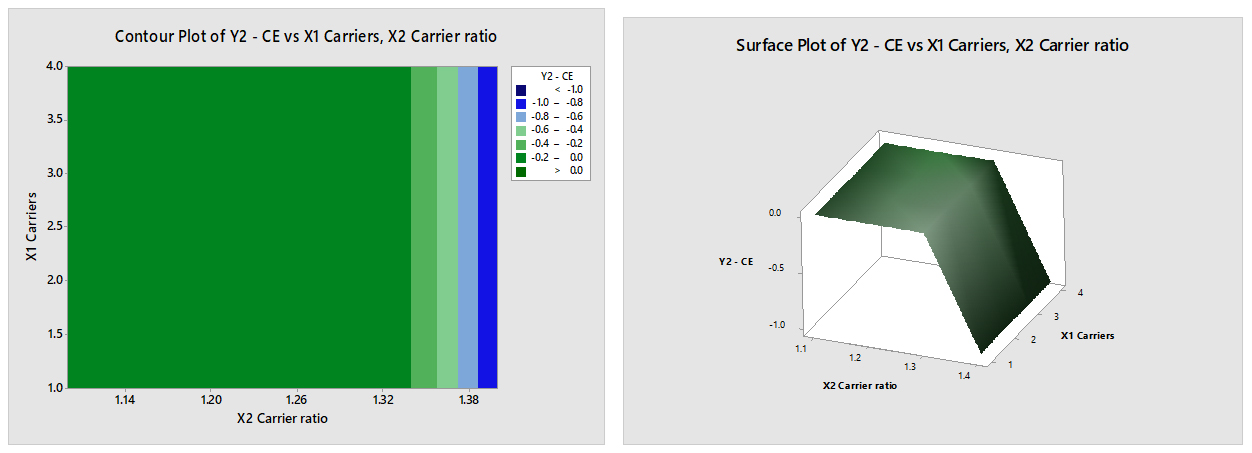
Figure 9:
Contour & Surface plot of Y2 (Complexation Efficiency) Vs X1 (Carriers) & X2 (Carrier ratio).
Y3-ΔG=551+2.9 X1 Carriers-478 X2 Carrier ratio
- The coefficient of X1 (2.9) suggests that for each unit increase in the amount of carriers (X1), the change in Gibbs free energy (Y3-ΔG) is expected to increase by 2.9 units. This implies that adding more carriers leads to an increase in the change in Gibbs free energy.
- The coefficient of X2 (-478) indicates that for each unit increase in the carrier ratio (X2), the change in Gibbs free energy (Y3-ΔG) is expected to decrease by 478 units (Figure 10). This suggests that increasing the ratio of carriers to solute results in a decrease in the change in Gibbs free energy.
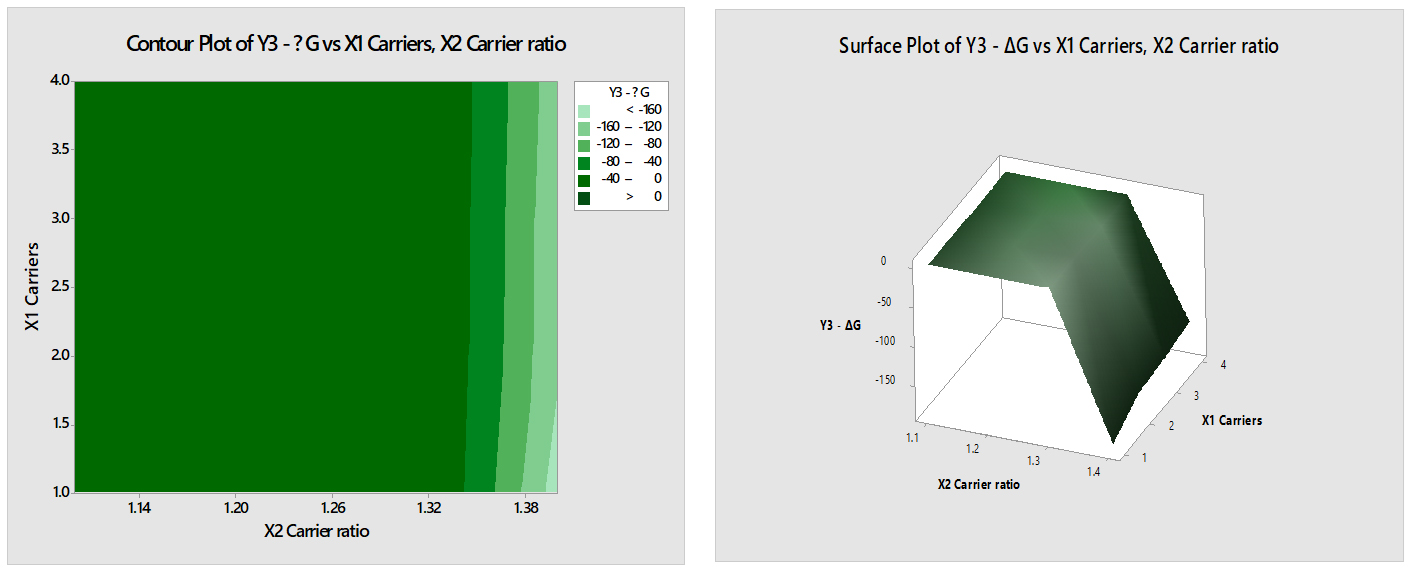
Figure 10:
Contour & Surface plot of Y3 (ΔG) Vs X1 (Carriers) & X2 (Carrier ratio).
Y4-Solubility=-28.4+6.123 X1 Carriers+20.80 X2 Carrier ratio
- The coefficient of X1 (6.123) suggests that for each unit increase in the amount of carriers (X1), the change in solubility (Y4-Solubility) is expected to increase by 6.123 units. This implies that adding more carriers leads to a positive change in solubility.
- The coefficient of X2 (20.80) indicates that for each unit increase in the carrier ratio (X2), the change in solubility (Y4-Solubility) is expected to increase by 20.80 units (Figure 11). This implies that increasing the ratio of carriers to solute results in a greater positive change in solubility.
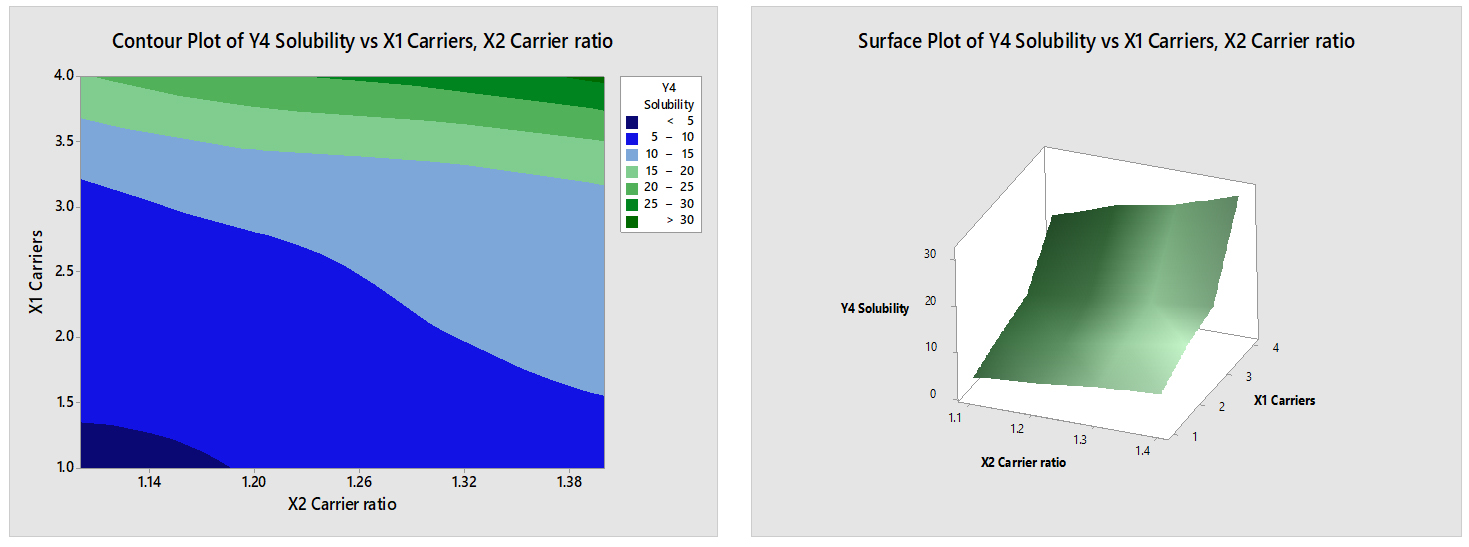
Figure 11:
Contour & Surface plot of Y4 (Solubility) Vs X1 (Carriers) & X2 (Carrier ratio).
DISCUSSION
The intercept term (-0.0375) represents the value of Y1-Ka when both the amount of carriers (X1) and the carrier ratio (X2) are zero. So, this equation suggests that both the amount of carriers and the carrier ratio contribute positively to the difference between Y1 and Ka. Increasing either one leads to an increase in this difference, with the carrier ratio having a larger impact per unit increase compared to the amount of carriers.
The intercept term (3.501) represents the value of Y2-CE when both the amount of carriers (X1) and the carrier ratio (X2) are zero. So, this equation suggests that while the amount of carriers doesn’t affect the difference between Y2 and CE, the carrier ratio does. Increasing the carrier ratio leads to a decrease in the difference between Y2 and CE.Top of Form
The intercept term (551) represents the expected change in Gibbs free energy when both the amount of carriers (X1) and the carrier ratio (X2) are zero. So, this equation suggests that the amount of carriers and the carrier ratio both have effects on the change in Gibbs free energy. Increasing the amount of carriers leads to an increase in the change in Gibbs free energy, while increasing the carrier ratio leads to a decrease in the change in Gibbs free energy.
The intercept term (-28.4) represents the expected change in solubility when both the amount of carriers (X1) and the carrier ratio (X2) are zero. So, this equation suggests that both the amount of carriers and the carrier ratio have positive effects on the change in solubility. Increasing either one leads to an increase in solubility, with the carrier ratio having a larger impact per unit increase compared to the amount of carriers.
CONCLUSION
The investigation into enhancing olanzapine solubility through various carriers provides valuable insights into improving drug delivery systems for better therapeutic outcomes. By employing phase solubility analysis, this study elucidates the role of carriers and carrier ratios in enhancing solubility-related parameters such as dissociation constant, complexation efficiency, Gibbs free energy and solubility. Furthermore, response surface methodology allows for the optimization of formulation parameters to maximize solubility enhancement. The findings suggest that careful selection of carriers and optimization of carrier ratios can significantly improve olanzapine solubility, thus addressing the challenges associated with its low oral bioavailability. The eminent solubility of Olanzapine was observed in 1:4 ratio of drug: PVP K-30 solution among other water soluble carriers. This research contributes to the advancement of pharmaceutical formulation strategies for poorly soluble drugs with various water soluble carriers.
Cite this article:
Sundaramoorthi R, Pavadai A, Sathappan J, Sivakumar SR. Comparative Phase Solubility Analysis of Olanzapine by 24 Optimization Techniques with Different Water-Soluble Carriers. Int. J. Pharm. Investigation. 2025;15(2):10-8.
ACKNOWLEDGEMENT
We extend our sincere appreciation to School of Pharmacy, Sri Balaji Vidyapeeth Deemed to be University, Puducherry for their invaluable support in providing instrumental, glassware, equipments and laboratory resources for this research. Their contributions have significantly enhanced the quality and scope of our work.
ABBREVIATIONS
| ΔG: | Gibb’s Energy |
|---|---|
| Ka: | Stability constant |
| FT-IR: | Fourier Transform Infrared Spectroscopy |
| KBr: | Potassium bromide |
| PEG 4000: | Polyethylene glycol 4000 |
| PVP K30: | Polyvinyl; Pyrrolidone K 30 |
| kJ: | Kilo Joules |
| CE: | Complexation Efficiency |
References
- Al Omari M. M. A., Badwan A. A., Zughul M. B., Eric J., Davies D.. (2007) Fexofenadine/cyclodextrin inclusion complexation: Phase solubility, thermodynamic, physicochemical and computational analysis. Drug Development and Industrial Pharmacy 33: 1205-1215 Google Scholar
- Bellaiah P. G., Hagalavadi N. S., Madalli R. K.. (2022) Indian Journal of Pharmaceutical Sciences, 712-22, 23 Factorial Design: An Approach for Formulation of Solid Lipid Nanoparticles of Etravirine for Oral Administration 84 Google Scholar
- Dixit M., Kini A. G. K., Kulkarni P. K.. (2011) Enhancing the aqueous solubility and dissolution of olanzapine using freeze-drying. Brazilian Journal of Pharmaceutical Sciences 47: 743-749 Google Scholar
- Dixit M., Narayana Charyulu R., Shetty A.. (2014) Enhancing solubility and dissolution of olanzapine by spray drying using beta-cyclodextrin polymer. Journal of Applied Pharmaceutical Sciences 4: Array Google Scholar
- Doile M. M., Fortunato K. A., Schmücker I. C., Schucko S. K., Silva M. A. S., Rodrigues P. O., et al. (2008) Physicochemical properties and dissolution studies of dexamethasone acetate-β-cyclodextrin Inclusion Complexes produced by different methods. AAPS PharmSciTech 9: 314-321 Google Scholar
- Kolli P., Kelley G., Rosales M., Faden J., Serdenes R.. (2023) Olanzapine pharmacokinetics: A clinical review of current insights and remaining questions. Pharmacogenomics and Personalized Medicine 16: 1097-1108 Google Scholar
- Krishnamoorthy V., Nagalingam A., Priya Ranjan Prasad V., Parameshwaran S., George N., Kaliyan P., et al. (2011) Characterization of olanzapine-solid dispersions. Iranian Journal of Pharmaceutical Research 10: 13-24 Google Scholar
- Nikghalb Ladan Akbarpour. (2012) Solid Dispersion: Methods and Polymers to increase the solubility of poorly soluble drugs. Journal of Applied Pharmaceutical Sciences 2: 170-175 Google Scholar
- Liu C., Desai K. G. H., Liu C., Park H. J.. (2004) Enhancement of dissolution rate of rofecoxib using solid dispersions with urea. Drug Development Research 63: 181-189 Google Scholar
- Saokham P., Muankaew C., Jansook P., Loftsson T.. (2018) Solubility of cyclodextrins and drug/cyclodextrin complexes. Molecules 23: 1161-1176 Google Scholar
- Shankarrao K. A.. (2010) Formulation and evaluation of olanzapine −2-hydroxypropyl-beta-cyclodextrin inclusion complex. Iranian Journal of Pharmaceutical Research 9: 335-347 Google Scholar
- Tekade A. R., Yadav J. N.. (2020) A review on solid dispersion and carriers used therein for solubility enhancement of poorly water-soluble drugs. Advanced Pharmaceutical Bulletin 10: 359-369 Google Scholar