ABSTRACT
Objectives
This study describes developing and validating a novel method using LC-MS/ MS to measure the concentration of Momelotinib in rat plasma.
Materials and Methods
The pharmacokinetic applicability of the process was assessed in rats using a Symmetry C18 column (250 mmx4.6 mm, 5 µm) at room temperature for separation. The mobile phase consisted of a mixture of acetonitrile and 0.1% formic acid (45:55) with a 1.0 mL/min flow rate and an injection volume of 10 µL. The Liquid Chromatography (LC) process was carried out over 5 min, with the mass spectrometer operating in positive ESI mode. The mass-to-charge ratio transitions for Momelotinib and Oclacitinib were determined as m/z 415.4285→160.4698 and 338.2142→266.9137, respectively.
Results and Discussion
The concentration range for Momelotinib was established at 7.50-60.00 ng/mL, with a correlation coefficient of 0.9999. The precision and accuracy for High-Quality Control (HQC), Medium-Quality Control (MQC), Low-Quality Control (LQC) and Lower Limit of Quantification (LLQC) were 97.52%, 98.97%, 95.46% and 92.55%, respectively. The recovery accuracy for Momelotinib was found to be 97.29%. In pharmacokinetic studies, Momelotinib exhibited an average AUC0-t of 156 ng-hr/mL and a Cmax of 27.2 ng/mL in rats.
Conclusion
In conclusion, this validated approach effectively demonstrates the determination of pharmacokinetic parameters following the oral administration of Momelotinib in Wistar rats.
INTRODUCTION
Bioanalysis studies the presence of analytes in biological samples, such as biomarkers, drugs and metabolites (Meng & Bennett, 2012; Tasic, 2022). This process consists of several key steps: data reporting, sample collection and sample analysis. The first step involves obtaining samples from clinical or preclinical studies. These samples are then sent to a laboratory for analysis (Yinet al., 2015; Déglonet al., 2015; Mikkelsen and Cortón, 2004). Following this, the bioanalysis process includes sample clean-up, also known as sample preparation, which is essential for achieving accurate and reliable results. To ensure precision, it’s vital to employ a sample preparation method that is both robust and stable, aimed at removing impurities from the sample matrix and optimizing the analytical system’s performance (Tan & Shaw, 2014; Konathamet al., 2022).
Momelotinib is a Janus Kinase 1 (JAK1) and 2 (JAK2) inhibitors and competitively inhibits JAK ATP binding. It was approved by FDA on September 15, 2023 (Xuet al., 2019; Winton & Kota, 2017). Momelotinib is used to treat myelofibrosis. Myelofibrosis (MF) is a group of myeloproliferative neoplasms characterized by abnormal proliferative hematopoietic stem cells, leading to the release of cytokines and growth factors. MF includes Primary MF (PMF), Post-polycythemia Vera (PV) MF and post-Essential Thrombocythemia (ET) MF (Chifotideset al., 2022; Keam 2023). Clinical manifestations of MF include anemia and thrombocytosis. Momelotinib works by blocking the JAK-Signal Transducer and Activator of Transcription (STAT) signalling pathway, which is aberrant in MF (GlaxoSmithKline, 2023).
In November 2023, the Committee for Medicinal Products for Human Use (CHMP) of the European Medicines Agency (EMA) adopted a positive opinion, recommending the granting of a marketing authorization for the medicinal product Omjjara (GlaxoSmithKline Trading Services Limited) January 2024 (GlaxoSmithKline, 2023; European Medicines Agency, 2023). Intended for the treatment of disease-related splenomegaly or symptoms in adults with moderate-to-severe anemia who have primary myelofibrosis, post-polycythemia vera myelofibrosis or post-essential thrombocythemia myelofibrosis. The most common nonhematologic treatment-emergent Adverse Event (AE) occurring in ≥20% of patients was diarrhea (any grade, 27% and grade ≥3, 3%). Any-grade thrombocytopenia, anemia and neutropenia occurred in 25%, 23% and 7% of patients, respectively (Verstovseket al., 2023). The chemical formula of Momelotinib C23H22N6O2 and its Molecular weight is 414.469 and its structure is shown in Figure 1.
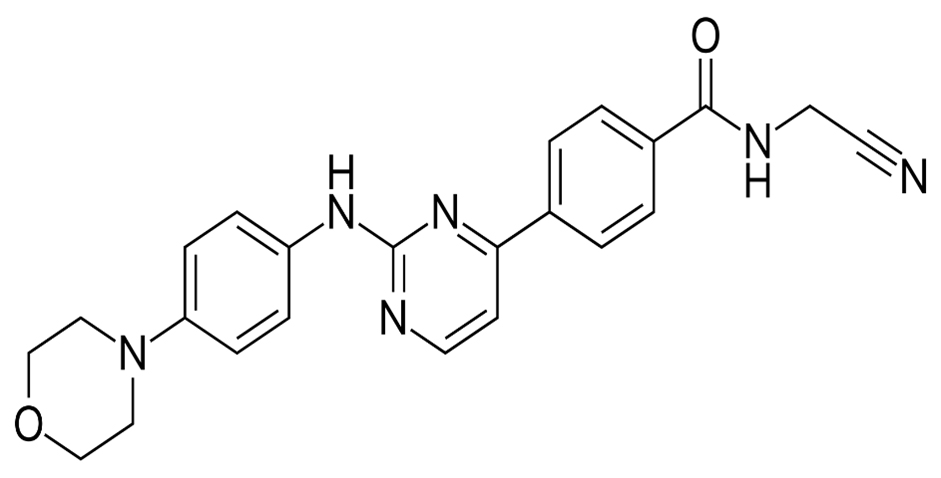
Figure 1:
Structure of Momelotinib.
MATERIALS AND METHODS
Chemical and Reagents
Samples of Momelotinib and Oclacitinib were supplied as the reference material by Cipla Pharmaceuticals in Vijayawada. All compounds, including LCMS-grade acetonitrile and formic acid, were procured from the chemical division of Merck located in Mumbai. Purified water (Milli-Q water purification system, HPLC Quality) was utilized throughout the investigation.
Instrumentation
Chromatography was carried out using a Waters 2695 HPLC equipped with a high-speed autosampler, column oven, degasser and a SCIEX QTRAP 5500 mass spectrometer using ABSCIEX software.
Stock and working solutions
Momelotinib Stock Solution (120 ng/mL).
Stock solutions were prepared using the mobile phase as a diluent. Six milligrams of Momelotinib working standard were weighed and transferred into a 100 mL volumetric flask, then diluted to volume with the diluent. 0.2 mL of this solution was further diluted to 10 mL with the diluent. Finally, 1 mL of this diluted solution was transferred into a 10 mL volumetric flask and made up to the mark with the diluent.
Preparation of Internal Standard Stock Solution (120 ng/mL)
Weigh 6 mg of Oclacitinib working standard and transfer it into a 100 mL volumetric flask diluted to volume with diluent. Further diluted 0.2 mL to 10 mL with diluent. Take 1 mL of the above solution into a 10 mL volumetric flask and make it up to the mark with diluents.
Preparation of Standard Solution (30 ng/mL of Momelotinib)
Transferred 500 µL of the standard stock solution into a 2 mL centrifuge tube. To this, add 200 µL of plasma, 500 µL of internal standard stock, 300 µL of acetonitrile and 500 µL of diluent. Centrifuged at 4000 rpm it to 15 min. Filter the supernatant liquid and transfer it into an HPLC vial.
Conditions of liquid chromatography and mass spectrometry
A Symmetry C18 analytical column (250 mmx4.6 mm, 5 µm) was employed for separation at room temperature. The mobile phase consisted of a mixture of acetonitrile and 0.1% formic acid in a 45:55 ratio, with a flow rate of 1.0 mL/min and an injection volume of 10 µL. The Liquid Chromatography (LC) process lasted 5 min, while the mass spectrometer operated in positive ESI mode. The mass-to-charge ratio transitions for Momelotinib and Oclacitinib (m/z 415.4285→160.4698 and 338.2142→266.9137, respectively) were determined using Multiple Reaction Monitoring (MRM), as shown in Figures 2 and 3.
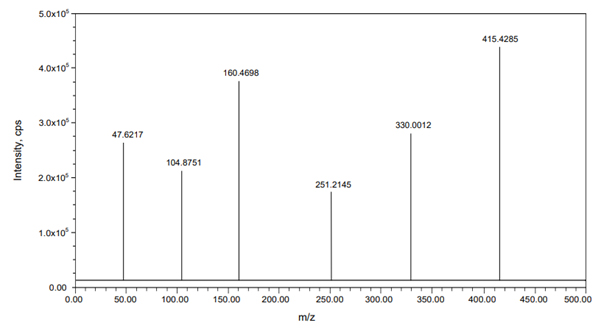
Figure 2:
Mass spectrum of Momelotinib.
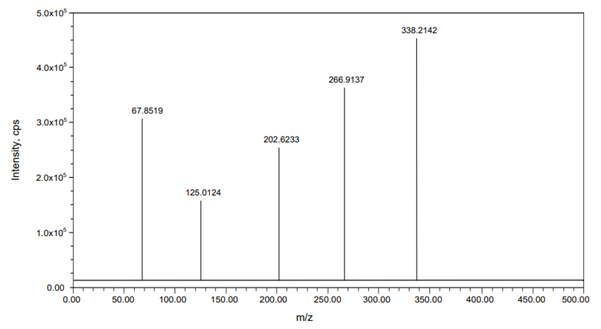
Figure 3:
Mass spectrum of Oclacitinib.
Preparations of Linearity solutions
Calibration curves were generated using standards at concentrations of 7.50, 15.00, 22.50, 30.00, 37.50, 45.00 and 60.00 ng/mL, which were centrifuged at 4000 rpm for 15 min. The supernatant was collected and transferred into the chromatograph using an HPLC container. Quality Control (QC) samples were prepared following the same procedure, with Momelotinib concentrations of LLOQQC at 3.00 ng/mL, LQC at 15.00 ng/mL, MQC at 30.00 ng/mL and HQC at 45.00 ng/mL.
Extraction protocol
Rat plasma was subjected to protein precipitation to isolate Momelotinib. The plasma samples were centrifuged, treated and labeled according to the appropriate time intervals. 200 μL of processed plasma was mixed with 300 μL of diluent, followed by 500 μL of acetonitrile to precipitate proteins. The mixture was vortexed and centrifuged at 4000 rpm for 15 min. The supernatant was collected and injected into the chromatograph using an HPLC-specific container.
Bio-analytical method validation
Following the FDA’s bioanalytical method guidelines, the devised method underwent comprehensive validation by computing all validation parameters as detailed below:
Selectivity
Selectivity refers to the ability of an analytical procedure to accurately distinguish and measure analytes even when interfering substances are present in the biological matrix. We utilize blank samples from at least six independent sources or lots to assess selectivity. These samples are processed without including any analyte or Internal Standard (IS).
Linearity
The calibration curve illustrates the relationship between the reaction and the known concentration of the analyte. Preparing the calibration curve using the same biological matrix as the samples is essential. Furthermore, distinct calibration curves are required for each analyte to be measured. The method’s range denotes the concentration interval where accuracy, precision and linearity have been established.
Accuracy and precision
During method development, verifying the technique’s suitability for validation is crucial by evaluating replicate Quality Controls (QCs) at various concentrations across the assay range. This includes examining replicate QCs at multiple concentrations. Method validation studies should consist of at least 6 independent runs, each featuring a calibration curve and multiple sample concentrations measured in replicates to assess accuracy and precision.
Recovery
The Six quality control samples (LQC, MQC and HQC) were either thawed or prepared fresh from the deep freezer. The IS was added to the quality control samples (extracted samples) prior to injection. A 100% extraction of the analyte was achieved by processing blank matrix samples sourced from a single lot. These samples were injected along with six sets of each quality control dilution at low, medium and high concentrations, with the IS included in the process. At each QC level and for the IS, the percent Coefficient of Variation (CV) of recovery should be less than 15.00%. The overall mean recovery percent CV should remain below 20.00% for all QC levels.
Matrix effects
The matrix effect is a variation in analyte reactivity caused by interfering and sometimes undetectable components in the sample matrix. The matrix effect was assessed 8 times for each analyte and internal standard at LQC and HQC concentration levels. 2 replicates of blank plasma samples were prepared using eight different screened plasma batches. The LQC concentration was spiked with the IS using one set of eight independent blank matrices, while the HQC concentration was spiked with the IS using a separate set. The analysis utilized spiked analyte(s) and the IS to reconstitute the solution, creating one set of aqueous samples comparable to the final LQC and HQC concentrations.
Stability experiments
Stability tests are essential to ensure that the concentration of the analyte remains unchanged throughout sample preparation, processing, analysis and storage conditions. Evaluating the analyte’s stability within the matrix is under investigation by utilizing quality controls for stability, including low and high concentrations. Once the storage conditions have been implemented at time 0, we analyze aliquots of the quality controls with low and high stability. Conducting and assessing at least three stability tests for every concentration level, storage condition and time point is imperative. The FDA has advised the following stability measures for biological investigations. Changing the analyte in any way can impact chromatographic behavior, making the method development process more complex.
The above parameters can make the development and validation processes much more accessible to implement. The approach is unacceptable for its intended purpose if selectivity cannot be demonstrated. It will be difficult to develop the approach if recovery is uneven and the analytes are fractionated after being adjusted. Accuracy, precision, range and other qualities would be considerably altered under such circumstances.
Application of the bio-analytical method to pharmacokinetics study
A cohort of six male Wistar rats weighing 180 and 220 g was utilized to conduct the pharmacokinetic experiments. The animals were accommodated in ventilated enclosures that were adequately supplied with food and water for seven days before the initiation of the experiments. The rats were fasted overnight before being given a dose. The animal study protocol has been approved by the Institute of Animal Ethics Committee (Registration Number: 1250/PO/RcBi/s/18/CPCSEA). A single dose of Momelotinib capsule (50 mg) was administered to rats; samples were collected at 0.5, 1.0, 1.5, 2.0, 3.0, 4.0, 6.0 and 8.0 hr post-dose. An aliquot of 5 mL blood was collected at each time point in K2 EDTA vacutainer tubes. Additionally, a predose sample was collected to check the possible interferences from the plasma. The collected samples were centrifuged to obtain the plasma and stored at -70 °C. Plasma samples were spiked with the IS and processed along with QC samples at four concentrations. Pharmacokinetic parameters of Momelotinib were calculated using WinNonlin (Version 5.2) software package. Stability of the study samples were established by Incurred Sample Reanalysis (ISR). For ISR two samples from each subject were selected near Cmax and the elimination phase in the pharmacokinetic profile. The samples were considered stable; the percent difference should not be more than 20%.
RESULTS
Mass spectrometry
To optimize the most sensitive ionization mode for Momelotinib and the Oclacitinib (IS), Electrospray Ionization (ESI) full scans were carried out both in positive and negative ion detection modes and it was found that both the analyte and the IS showed a better response in positive ion mode. At m/z 415.4285 and 338.2142, respectively, Momelotinib and Oclacitinib generated protonated [M+H]+ in positive ion mode. Figure 2 depicts the proposed Momelotinib fragmentation pattern. Momelotinib was quantified using the MRM reaction pair of the m/z 415.4285 precursor ion (Q1) to the m/z 160.4698 daughter ion (Q3) after the MS parameters were carefully optimized. The ideal option to be utilized as an IS is the deuterated analog of Momelotinib. Because deuterated Momelotinib was unavailable, we used a similar structurally and pKa value like a compound Oclacitinib chosen as an IS. This compound was the best for the current study based on chromatographic elution, ionization, reproducibility and good extraction efficiency. For the quantitation of IS, the MRM reaction pair of m/z 338.2142 precursor ion (Q1) to the m/z 266.9137 daughter ion (Q3) was used for the developed and validated optimized method.
Liquid Chromatography
The mobile phase choice significantly impacts the internal standard, analyte separation and ionization. To best achieve an effective chromatographic resolution of Momelotinib and the Oclacitinib (IS), a variety of mixtures of solvents, such as acetonitrile and methanol, with different buffers, such as formic acid, phosphate buffer, acetate buffer, ammonium acetate and ammonium formate, were tested. To optimize the separation of Momelotinib and Oclacitinib without any endogenous interference and to get a satisfactory and repeatable response with a short run time, many HPLC columns, including Inertsil, Atlantis, Zorbax, Gemini, C18 and C8, were investigated. The resolution of the analyte and the IS was best achieved with an isocratic mobile phase comprising Acetonitrile and 0.1% formic acid (45:55, v/v) at a flow rate of 1.0 mL/min. Symmetry C18 column, 250 mmx4.6 mm, 5µm, was found to be suitable with sharp and symmetric peak shapes. Momelotinib and Oclacitinib eluted at 2.524 and 3.567 min, respectively, in a total run time of 5.0 min.
Selectivity
When comparing the peak response of blank samples with the response of spiked LLOQ samples containing IS mixtures, it was shown that the selectivity of the method demonstrated the absence of interference with Momelotinib of both the analyte and the IS (see Figures 4 and 5).
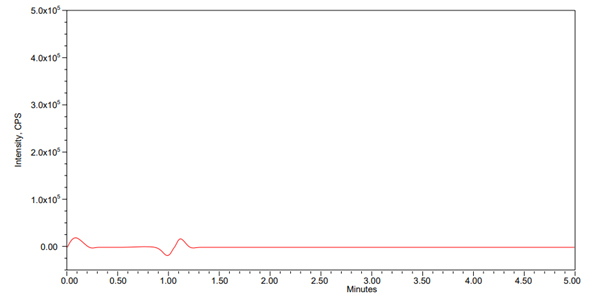
Figure 4:
Chromatogram of Blank.
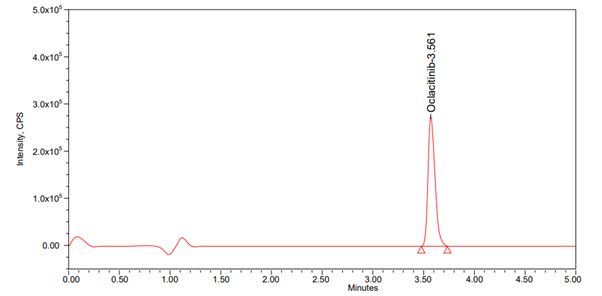
Figure 5:
Blank chromatogram+IS.
Linearity
The linearity of the standard curves for Momelotinib was observed within the concentration range of 7.50 to 60.00 ng/mL, with an average correlation coefficient of 0.9998. Sample quantities were determined by calculating the ratio of the peak areas of the analyte to that of the IS. The peak area ratios corresponding to the plasma concentrations are presented graphically in Table 1 and Figure 6.
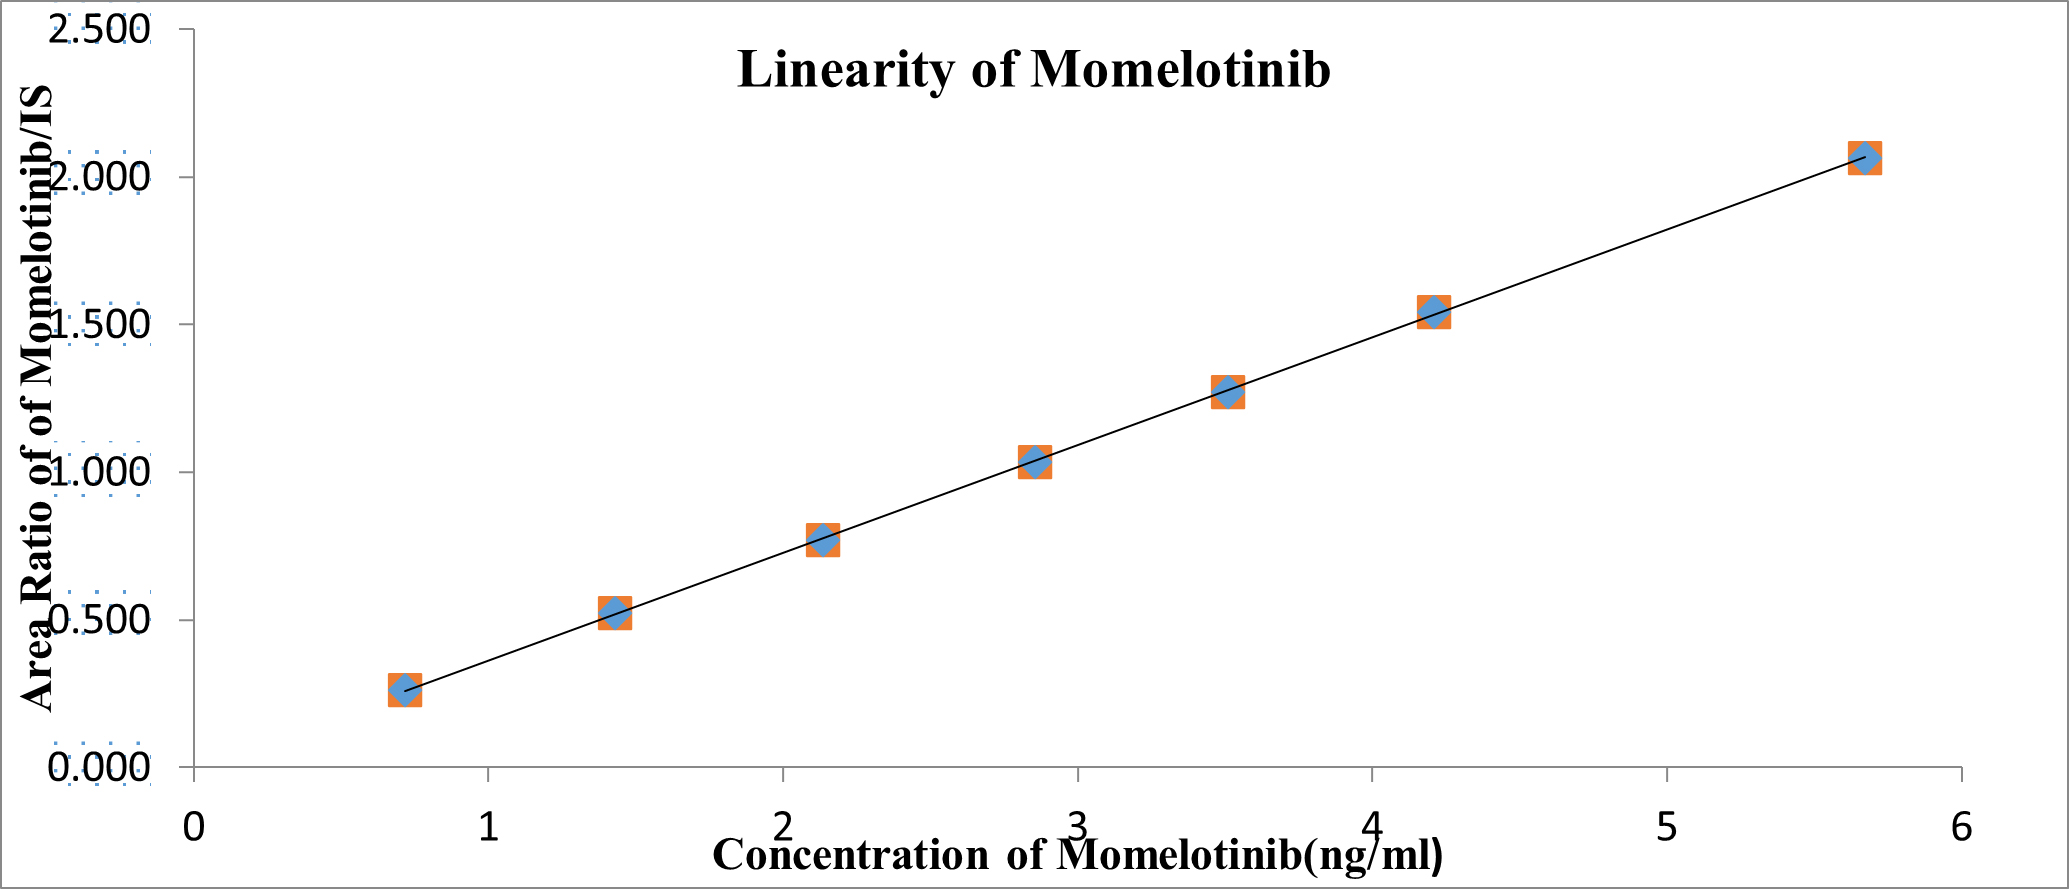
Figure 6:
Calibration plot for concentration v/s Area ratio of Momelotinib.
| Conc. (ng/mL) | Momelotinib Peak Response | Oclacitinib Peak Response | Ratio |
|---|---|---|---|
| 0 | 0 | 0 | 0 |
| 7.50 | 0.718 | 2.745 | 0.262 |
| 15.00 | 1.429 | 2.736 | 0.522 |
| 22.50 | 2.134 | 2.771 | 0.770 |
| 30.00 | 2.855 | 2.758 | 1.035 |
| 37.50 | 3.509 | 2.764 | 1.270 |
| 45.00 | 4.208 | 2.728 | 1.543 |
| 60.00 | 5.672 | 2.749 | 2.063 |
| Slope | 0.0341 | ||
| Intercept | 0.00628 | ||
| R2 Value | 0.99982 | ||
Precision and accuracy
The Six duplicates of Momelotinib were analyzed at three distinct Quality Control (QC) levels to evaluate intra-assay precision and accuracy. Inter-assay precision was determined by analyzing the three levels of QC samples across independent runs. The proposed method demonstrated a percent mean accuracy ranging from 92.55% to 98.97%, with precision (% CV) for LQC, MQC and HQC ranging from 0.17% to 1.43%. The findings are summarized in Table 2.
| Injections | HQC | MQC | LQC | LLQC |
|---|---|---|---|---|
| 1 | 4.121×10⁵ | 2.799×10⁵ | 1.344×10⁵ | 0.259×10⁵ |
| 2 | 4.125×10⁵ | 2.788×10⁵ | 1.348×10⁵ | 0.258×10⁵ |
| 3 | 4.126×10⁵ | 2.794×10⁵ | 1.346×10⁵ | 0.261×10⁵ |
| 4 | 4.129×10⁵ | 2.786×10⁵ | 1.347×10⁵ | 0.265×10⁵ |
| 5 | 4.123×10⁵ | 2.787×10⁵ | 1.349×10⁵ | 0.257×10⁵ |
| 6 | 4.128×10⁵ | 2.793×10⁵ | 1.341×10⁵ | 0.266×10⁵ |
| Mean | 4.125×10⁵ | 2.791×10⁵ | 1.346×10⁵ | 0.261×10⁵ |
| SD | 0.00301 | 0. 00598 | 0.00293 | 0.00374 |
| % CV | 0.17 | 0.20 | 0.22 | 1.43 |
| %Mean Accuracy | 97.52% | 98.97% | 95.46% | 92.55% |
Recovery
It was determined that the average recovery rate for Momelotinib was 97.29%, while the average recovery for the IS at the tested concentration was 96.84%. Tables 3 and 4 present the findings, which indicate that the extraction efficiency for Momelotinib was suitable, consistent and independent of concentration when using the liquid-liquid extraction technique.
| Extracted LQC | Un extracted LQC | Extracted MQC | Un extracted MQC | Extracted HQC | Un extracted HQC | |
|---|---|---|---|---|---|---|
| Mean | 1.340×10⁵ | 1.366×10⁵ | 2.766×10⁵ | 2.784×10⁵ | 4.111×10⁵ | 4.138×10⁵ |
| SD | 0.00380 | 0.00234 | 0.00339 | 0.00308 | 0.00434 | 0.00400 |
| %CV | 0.28 | 0.17 | 0.12 | 0.11 | 0.11 | 0.10 |
| %Mean Recovery | 95.04% | 96.88% | 98.09% | 98.72% | 97.19% | 97.83% |
| Overall Recovery | 97.29 | |||||
| Sl. No. | Extracted Area Ratio | Un Extracted Area Ratio |
|---|---|---|
| 1. | 2.619×10⁵ | 2.652×10⁵ |
| 2. | 2.618×10⁵ | 2.654×10⁵ |
| 3. | 2.622×10⁵ | 2.659×10⁵ |
| 4. | 2.614×10⁵ | 2.657×10⁵ |
| 5. | 2.623×10⁵ | 2.653×10⁵ |
| 6. | 2.611×10⁵ | 2.661×10⁵ |
| Mean | 2.618×10⁵ | 2.656×10⁵ |
| SD | 0.00462 | 0.00358 |
| % CV | 0.18 | 0.13 |
| %Mean Recovery | 96.14% | 97.54% |
Matrix Effect
Back estimated concentrations of HQC and LQC levels had a mean percent accuracy of 97.16 and 96.45%, respectively. Because the results tabulated in Table 5 met the acceptance criterion of 85.00-115.00%, the present approach did not demonstrate any ionization effects.
| Mean | 4.110×10⁵ | 1.360×10⁵ |
|---|---|---|
| SD | 0.00618 | 0.00539 |
| %CV | 0.15 | 0.40 |
| % Mean Accuracy | 97.16% | 96.45% |
| No. of QC Failed | 0 | 0 |
Stability
Momelotinib stability in plasma was assessed using 6 duplicate Quality Control (QC) samples at low and high concentrations. Momelotinib standard solutions were added in the appropriate volumes to generate drug-free plasma samples. The findings in Table 6 were determined to be within the acceptable range, suggesting that Momelotinib exhibits favorable stability.
| Stability Parameters | Spiked concentration | Mean±SD | %RSD | % Accuracy |
|---|---|---|---|---|
| Bench Top (8 hr) | 15 (ng/mL) 45 (ng/mL) | 1.343×10⁵±0.00407 4.148×10⁵±0.00410 | 0.30 0.25 | 95.25 98.06 |
| Freeze Thaw | 1.352×10⁵±0.00718 4.145×10⁵±0.00460 | 0.53 0.11 | 95.89 97.99 | |
| Wet extract (18 hr) | 1.341×10⁵±0.00437 4.150×10⁵±0.00417 | 0.33 0.10 | 95.11 98.11 | |
| Dry Extract (18 Hr) | 1.347×10⁵±0.00649 4.130×10⁵±0.00564 | 0.48 0.14 | 95.53 97.64 | |
| Autosampler (for 12 hr) | 1.349×10⁵±0.00626 4.160×10⁵±0.00580 | 0.49 0.14 | 95.67 98.35 | |
| Short Term (24 hr) | 1.324×10⁵±0.00216 4.020×10⁵±0.00603 | 0.16 0.15 | 93.90 95.04 | |
| Long Term (28 Days) | 1.165×10⁵±0.00279 3.637×10⁵±0.00376 | 0.24 0..10 | 82.62 85.98 |
Pharmacokinetic application
The pharmacokinetic properties of Momelotinib were determined by calculation. The peak plasma Concentration (Cmax) and time to reach peak plasma concentration (Tmax) values were extracted directly from the plasma time profile curve shown in Figure 7. The pharmacokinetic characteristics of Momelotinib were determined using the WinNonlin software tool (Version 5.2). The stability of the research samples was determined using Incurred Sample Reanalysis (ISR). The linear trapezoidal method estimated several pharmacokinetic parameters such as AUC 0-t, AUC0-∞, t1/2, Cmax, Tmax and Clearance (CL). The above estimates were consolidated and presented in Table 7.
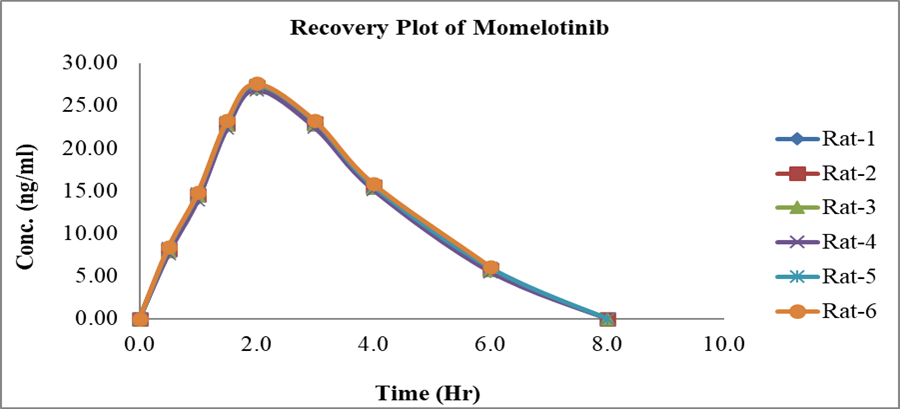
Figure 7:
Mean plasma concentration-time profile Momelotinib in Rat plasma.
| Pharmacokinetic parameters | Momelotinib |
|---|---|
| AUC0-t | 156 ng-hr/mL |
| Cmax | 27.2 ng/mL |
| AUC0-∞ | 156 ng-hr/mL |
| tmax | 2.0 hr |
| T1/2 | 6.0 hr |
DISCUSSION
The literature study ended with the non-availability of LC-MS/MS methods for determining Momelotinib. This method uses fewer toxic solvents and less solvent consumption. Overall extraction is conducted by a systematic pathway and bioanalytical methods guidelines. In this developed current study, the solvent used for the extraction procedure is entirely novel and new. Each parameter is well evaluated in the method validation and all data mentioned are within acceptable limits. The linearity study, at a low level of quantification to a high level of qualification with excellent correlation coefficient value, indicates the efficacy of the proposed method. By slight change, the parameters like mobile phase, flow rate and others are not affected by the quantification
of Momelotinib from the biological matrix and used of rat plasma for develop the proposed method and properly validated each parameter with the extracted Momelotinib and Oclacitinib (IS) sample from the rat plasma are help to get the novelty of proposed method and serves to supplement pivotal studies and aid in the decision-making process for approval, safety, labeling of a drug or biologic and, choice of the biomarker in biological fluids. In addition, a pharmacokinetic study of Momelotinib in rat plasma was successfully conducted using this optimized method, which is an added advantage.
CONCLUSION
A method for accurately and precisely identifying Momelotinib using LC-MS/MS has been developed. This technique is also sensitive and allows for rapid analysis. Oclacitinib is used as the IS in this procedure. The total chromatography runtime is 5.00 min, with retention times of 2.524 min for Momelotinib and 3.567 min for Oclacitinib. Momelotinib has been validated over a dynamic linear range of 7.50 to 60.00 ng/mL, yielding a correlation coefficient (r²) of 0.9999. The new bioanalytical method has been validated according to USFDA standards, with all validation parameters confirmed to be within acceptable limits. According to guidelines, precision (%CV) for both intra-batch and inter-batch measurements should be below 15% across LQC, MQC and HQC levels. Stability studies showed that results remained within assay variability limits at all stages. This optimized method successfully conducted a pharmacokinetic study of Momelotinib in rat plasma. Additionally, a simpler, more efficient and cost-effective protein precipitation method was developed for pre-treating biological samples, outperforming previously reported techniques. Plasma concentrations of Momelotinib were measured and key pharmacokinetic parameters were determined.
Cite this article:
Babu BS, Baby NR, Mondal S. Determination of Momelotinib in Rat Plasma by LC-MS/MS: Application to Pharmacokinetics Study. Int. J. Pharm. Investigation. 2025;15(2):10-8.
ACKNOWLEDGEMENT
The authors would like to thank all faculty members and management of the GITAM Gandhi Nagar, Rushikonda, Visakhapatnam, Andhra Pradesh, for providing all necessary technical support and motivating us at every stage.
ABBREVIATIONS
| FDA: | Food drug administration |
|---|---|
| QC: | Quality control |
| LQC: | Low-quality control |
| MQC: | Medium Quality control |
| HQC: | High-quality control |
| Rt: | Retention time. |
References
- Chifotides H. T., Bose P., Verstovsek S.. (2022) Momelotinib: An emerging treatment for myelofibrosis patients with anemia. Journal of Hematology and Oncology 15: 7 Google Scholar
- Déglon J., Leuthold L. A., Thomas A.. (2015) Potential missing steps for a wide use of dried matrix spots in biomedical analysis. Bioanalysis 7: 2375-2385 Google Scholar
- . (2023) CHMP summary of positive opinion for Omjjara (momelotinib) Google Scholar
- . (2023) Ojjaara (Momelotinib) Is Approved in the US as the First and Only Treatment Indicated for Myelofibrosis Patients with Anemia [Media Release] Google Scholar
- . (2023) (momelotinib): US prescribing information Google Scholar
- Keam S. J.. (2023) Momelotinib. First approval. Drugs 83: 1709-1715 Google Scholar
- Konatham T. K. R., Kumaraswamy G., Penke V. B., Vinay M. K. C., Pavuluri C., Rajinikanth S., et al. (2022) A critical review on bioanalytical method development and validation of few oncology drugs by using LC-MS-MS. Journal of Pharmaceutical Negative Results : 16-27 Google Scholar
- . (2012) LC-MS in drug bioanalysis : 33-66 Google Scholar
- . (2004) Validation of new bioanalytical methods. Bioanalytical chemistry : 322-345 Google Scholar
- Tan S. K., Shaw P. N. P.. (2014) Strategies for the detection and elimination of matrix effects in quantitative LC-MS analysis. LCGC North America 32: 54-64 Google Scholar
- . (2022) Tools and trends in bioanalytical chemistry : 53-82 Google Scholar
- Verstovsek S., Mesa R., Gupta V., Lavie D., Dubruille V., Cambier N., Platzbecker U., Hus M., Xicoy B., Oh S. T., Kiladjian J.-J., Vannucchi A. M., Gerds A., Egyed M., Mayer J., Sacha T., Kawashima J., Morris M., Huang M., Harrison C., et al. (2023) Momelotinib long-term safety and survival in myelofibrosis: Integrated analysis of phase 3 randomized controlled trails. Blood Advances 7: 3582-3591 Google Scholar
- Winton E. F., Kota V.. (2017) Momelotinib in myelofibrosis: JAK1/2 inhibitor with a role in treating and understanding the anemia. Future Oncology 13: 395-407 Google Scholar
- Xu L., Feng J., Gao G., Tang H.. (2019) Momelotinib for the treatment of myelofibrosis. Expert Opinion on Pharmacotherapy 20: 1943-1951 Google Scholar
- Yin P., Lehmann R., Xu G.. (2015) Effects of pre-analytical processes on blood samples used in metabolomics studies. Analytical and Bioanalytical Chemistry 407: 4879-4892 Google Scholar